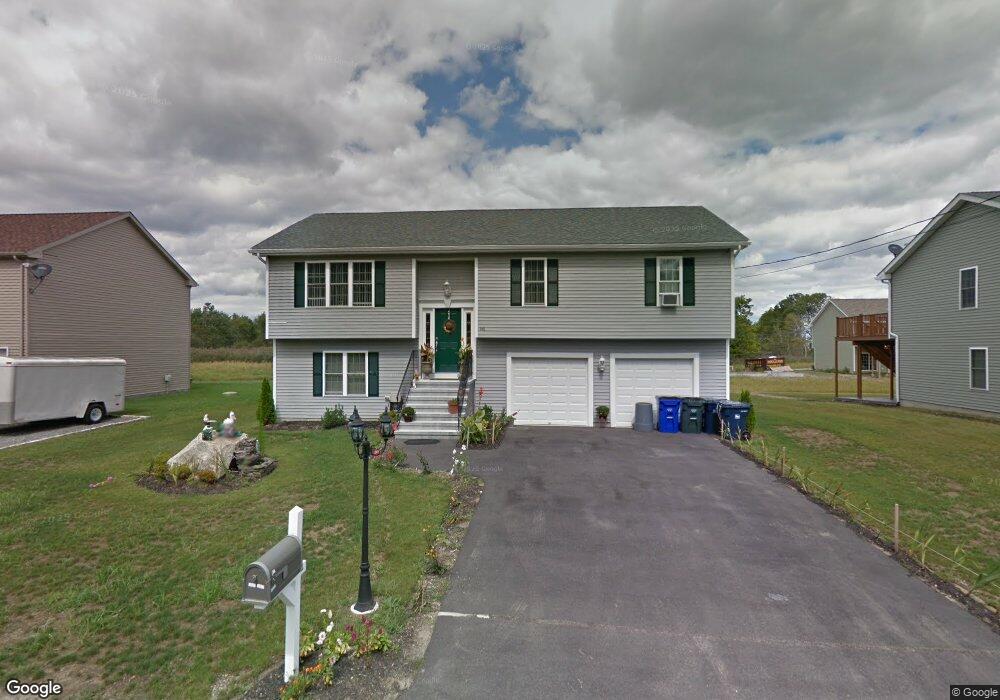
148 Lynwood St Fall River, MA 02721
Maplewood NeighborhoodEstimated Value: $519,745 - $590,000
3
Beds
2
Baths
1,290
Sq Ft
$427/Sq Ft
Est. Value
About This Home
This home is located at 148 Lynwood St, Fall River, MA 02721 and is currently estimated at $551,436, approximately $427 per square foot. 148 Lynwood St is a home located in Bristol County with nearby schools including Henry Lord Community School, B M C Durfee High School, and Argosy Collegiate Charter School.
Ownership History
Date
Name
Owned For
Owner Type
Purchase Details
Closed on
May 2, 2023
Sold by
Braga Roberto C
Bought by
Braga Roberto C and Braga Ana P
Current Estimated Value
Purchase Details
Closed on
Dec 15, 2011
Sold by
Can-Four Corp
Bought by
Braga Roberto C
Home Financials for this Owner
Home Financials are based on the most recent Mortgage that was taken out on this home.
Original Mortgage
$229,320
Interest Rate
4.01%
Mortgage Type
Purchase Money Mortgage
Create a Home Valuation Report for This Property
The Home Valuation Report is an in-depth analysis detailing your home's value as well as a comparison with similar homes in the area
Home Values in the Area
Average Home Value in this Area
Purchase History
| Date | Buyer | Sale Price | Title Company |
|---|---|---|---|
| Braga Roberto C | -- | None Available | |
| Braga Roberto C | $239,000 | -- |
Source: Public Records
Mortgage History
| Date | Status | Borrower | Loan Amount |
|---|---|---|---|
| Previous Owner | Braga Roberto C | $229,320 |
Source: Public Records
Tax History Compared to Growth
Tax History
| Year | Tax Paid | Tax Assessment Tax Assessment Total Assessment is a certain percentage of the fair market value that is determined by local assessors to be the total taxable value of land and additions on the property. | Land | Improvement |
|---|---|---|---|---|
| 2025 | $5,043 | $440,400 | $118,300 | $322,100 |
| 2024 | $4,205 | $366,000 | $116,000 | $250,000 |
| 2023 | $4,498 | $366,600 | $104,500 | $262,100 |
| 2022 | $3,946 | $312,700 | $98,600 | $214,100 |
| 2021 | $3,697 | $267,300 | $94,200 | $173,100 |
| 2020 | $3,597 | $248,900 | $89,900 | $159,000 |
| 2019 | $3,689 | $253,000 | $94,000 | $159,000 |
| 2018 | $3,544 | $242,400 | $94,700 | $147,700 |
| 2017 | $3,377 | $241,200 | $94,700 | $146,500 |
| 2016 | $3,232 | $237,100 | $97,600 | $139,500 |
| 2015 | $3,435 | $262,600 | $82,800 | $179,800 |
| 2014 | $3,179 | $252,700 | $72,900 | $179,800 |
Source: Public Records
Map
Nearby Homes
- 24 Bronson St
- 20 Bronson St
- 16 Bronson St
- 4 Bronson St
- 12 Bronson St
- 8 Bronson St
- 17 Lynwood St
- 495 Hooper St
- 153 Fish Rd Unit 4
- 579 Summit St Unit 3
- 579 Summit St Unit 2
- 88 Kenyon Rd
- 81 Kenyon Rd
- 238 Judson St
- 64 Kenyon Rd
- 584-586 Mount Hope Ave
- 126 Wheeler St
- 217 Napoleon St
- 0 Kaufman Rd Unit 73333701
- 0 Kaufman Rd Unit 1384670
- 164 Lynwood St
- 130 Lynwood St
- 157 Whitefield St
- 125 Lynwood St
- 180 Lynwood St
- 145 Whitefield St
- 169 Whitefield St
- 113 Lynwood St
- 112 Lynwood St
- 108 Lynwood St
- 181 Whitefield St
- 101 Lynwood St
- 3 Frederick St
- 196 Lynwood St
- 193 Whitefield St
- 285 Whitefield St
- 89 Lynwood St
- 189 Lynwood St
- 88 Frederick St
- 86 Lynwood St