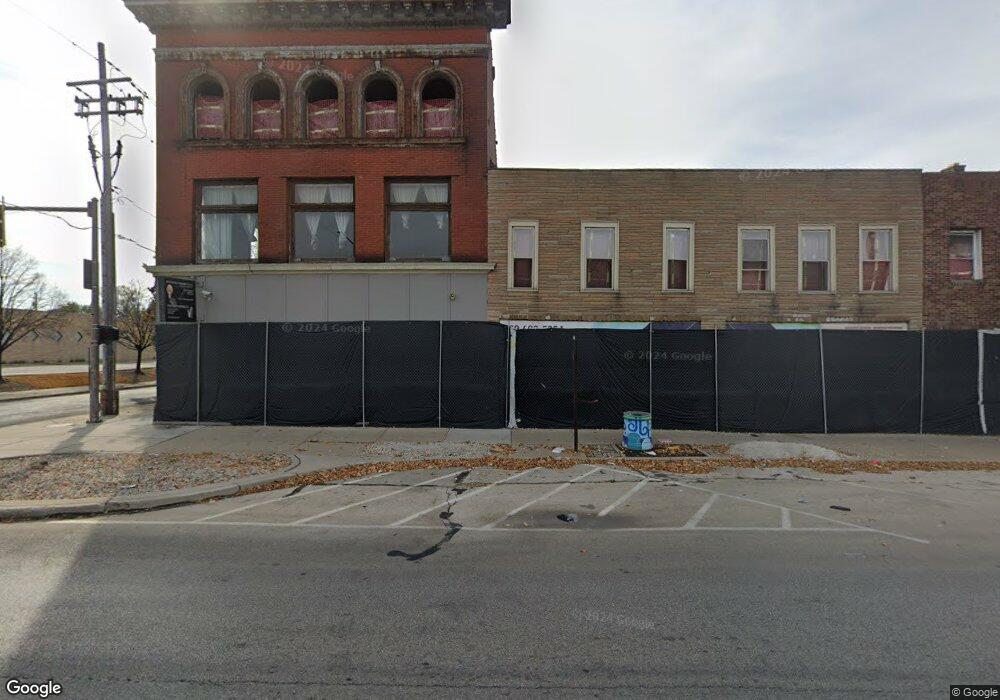
148 Main St Toledo, OH 43605
East Toledo NeighborhoodEstimated Value: $146,337
Studio
--
Bath
10,890
Sq Ft
$13/Sq Ft
Est. Value
About This Home
This home is located at 148 Main St, Toledo, OH 43605 and is currently estimated at $146,337, approximately $13 per square foot. 148 Main St is a home located in Lucas County with nearby schools including Garfield Elementary School, Waite High School, and Toledo Preparatory Academy.
Ownership History
Date
Name
Owned For
Owner Type
Purchase Details
Closed on
Sep 13, 2021
Sold by
Com Dev, Llc An Ohio Limited Liability C
Bought by
Main Town Llc
Current Estimated Value
Home Financials for this Owner
Home Financials are based on the most recent Mortgage that was taken out on this home.
Interest Rate
2.88%
Purchase Details
Closed on
Jul 29, 2005
Sold by
Croak Robert J and Croak Robert
Bought by
Com Dev Llc
Purchase Details
Closed on
Oct 13, 2000
Sold by
King Teresa A
Bought by
Croak Robert
Purchase Details
Closed on
Nov 20, 1989
Create a Home Valuation Report for This Property
The Home Valuation Report is an in-depth analysis detailing your home's value as well as a comparison with similar homes in the area
Home Values in the Area
Average Home Value in this Area
Purchase History
| Date | Buyer | Sale Price | Title Company |
|---|---|---|---|
| Main Town Llc | $230,600 | -- | |
| Com Dev Llc | -- | -- | |
| Croak Robert | $73,000 | -- | |
| -- | $130,000 | -- |
Source: Public Records
Mortgage History
| Date | Status | Borrower | Loan Amount |
|---|---|---|---|
| Closed | Main Town Llc | -- |
Source: Public Records
Map
Nearby Homes
Your Personal Tour Guide
Ask me questions while you tour the home.