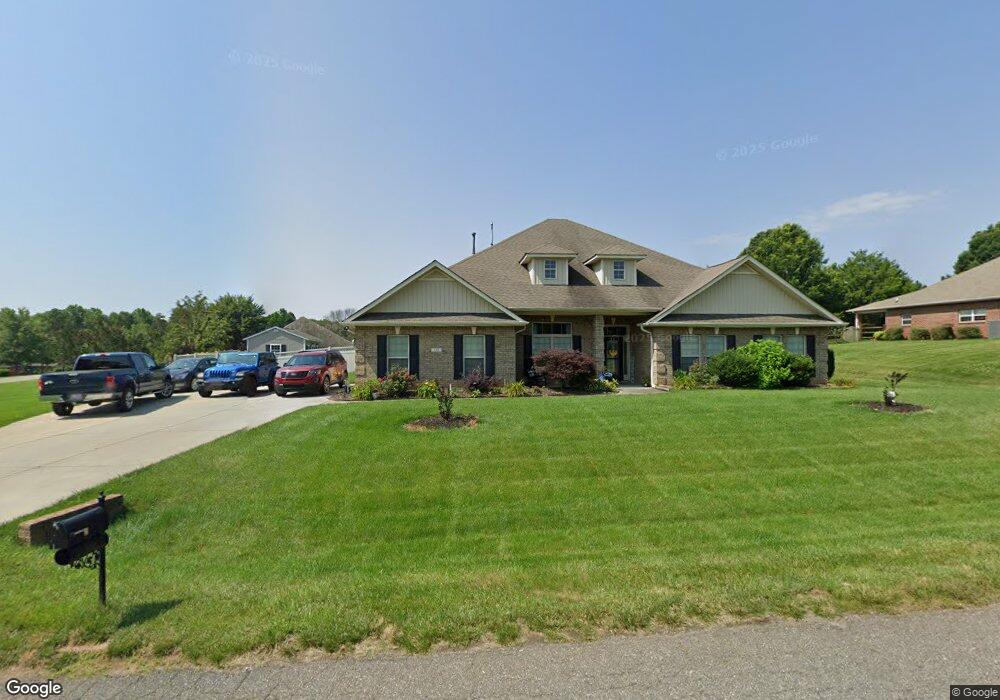
148 Mills Plantation Cir Troutman, NC 28166
Estimated Value: $579,000 - $621,000
4
Beds
3
Baths
2,846
Sq Ft
$209/Sq Ft
Est. Value
About This Home
This home is located at 148 Mills Plantation Cir, Troutman, NC 28166 and is currently estimated at $593,516, approximately $208 per square foot. 148 Mills Plantation Cir is a home located in Iredell County with nearby schools including Shepherd Elementary School, Troutman Middle School, and South Iredell High School.
Ownership History
Date
Name
Owned For
Owner Type
Purchase Details
Closed on
Dec 29, 2015
Sold by
Boler Katherine and Sanders Crystal
Bought by
Kennedy Brian Keith and Kennedy Tammy Coins
Current Estimated Value
Home Financials for this Owner
Home Financials are based on the most recent Mortgage that was taken out on this home.
Original Mortgage
$309,750
Outstanding Balance
$244,778
Interest Rate
4.01%
Mortgage Type
New Conventional
Estimated Equity
$348,738
Purchase Details
Closed on
Oct 31, 2008
Sold by
Adams Homes Aec Llc
Bought by
Boler Katherine and Sanders Crystal
Home Financials for this Owner
Home Financials are based on the most recent Mortgage that was taken out on this home.
Original Mortgage
$275,793
Interest Rate
5.78%
Mortgage Type
FHA
Purchase Details
Closed on
Jan 3, 2008
Sold by
Georgia Mills Llc
Bought by
Adams Homes Aec Llc
Create a Home Valuation Report for This Property
The Home Valuation Report is an in-depth analysis detailing your home's value as well as a comparison with similar homes in the area
Home Values in the Area
Average Home Value in this Area
Purchase History
| Date | Buyer | Sale Price | Title Company |
|---|---|---|---|
| Kennedy Brian Keith | $325,000 | None Available | |
| Boler Katherine | $299,000 | None Available | |
| Adams Homes Aec Llc | $1,200,000 | None Available |
Source: Public Records
Mortgage History
| Date | Status | Borrower | Loan Amount |
|---|---|---|---|
| Open | Kennedy Brian Keith | $309,750 | |
| Previous Owner | Boler Katherine | $275,793 |
Source: Public Records
Tax History Compared to Growth
Tax History
| Year | Tax Paid | Tax Assessment Tax Assessment Total Assessment is a certain percentage of the fair market value that is determined by local assessors to be the total taxable value of land and additions on the property. | Land | Improvement |
|---|---|---|---|---|
| 2025 | $2,680 | $444,090 | $52,500 | $391,590 |
| 2024 | $2,680 | $444,090 | $52,500 | $391,590 |
| 2023 | $2,680 | $444,090 | $52,500 | $391,590 |
| 2022 | $2,240 | $347,430 | $42,000 | $305,430 |
| 2021 | $2,236 | $347,430 | $42,000 | $305,430 |
| 2020 | $2,236 | $347,430 | $42,000 | $305,430 |
| 2019 | $2,132 | $347,430 | $42,000 | $305,430 |
| 2018 | $1,942 | $316,240 | $31,500 | $284,740 |
| 2017 | $1,864 | $303,240 | $31,500 | $271,740 |
| 2016 | $1,696 | $275,080 | $31,500 | $243,580 |
| 2015 | $1,696 | $275,080 | $31,500 | $243,580 |
| 2014 | $1,479 | $257,190 | $29,400 | $227,790 |
Source: Public Records
Map
Nearby Homes
- 144 Sugar Hill Rd
- 306 Fesperman Cir
- 212 Sugar Hill Rd
- 189 Fesperman Cir
- 232 Sugar Hill Rd
- 108 Fairfield Dr
- 114 Fairfield Dr
- 144 Fairfield Dr
- 154 Fairfield Dr
- 136 Satchel Ct
- 130 Satchel Ct
- 126 Satchel Ct
- 135 Satchel Ct
- 127 Satchel Ct
- 125 Satchel Ct
- 131 Satchel Ct
- 144 Satchel Ct
- 119 Fern Ln
- 117 Carmine Ct
- 114 Obadiah Ct
- 140 Mills Plantation Cir
- 164 Mills Plantation Cir
- 147 Mills Plantation Cir
- 141 Mills Plantation Cir
- 141 Mills Plantation Cir Unit 39
- 132 Mills Plantation Cir
- 151 Mills Plantation Cir
- 155 Mills Plantation Cir
- 161 Mills Plantation Cir
- 161 Mills Plantation Cir Unit 35
- 114 Kings Mtn Ct
- 133 Mills Plantation Cir
- 110 Kings Mtn Ct
- 169 Mills Plantation Cir
- 172 Mills Plantation Cir
- 122 Mills Plantation Cir
- 115 Kings Mtn Ct
- 125 Mills Plantation Cir
- 175 Mills Plantation Cir
- 601 Shepherd Rd