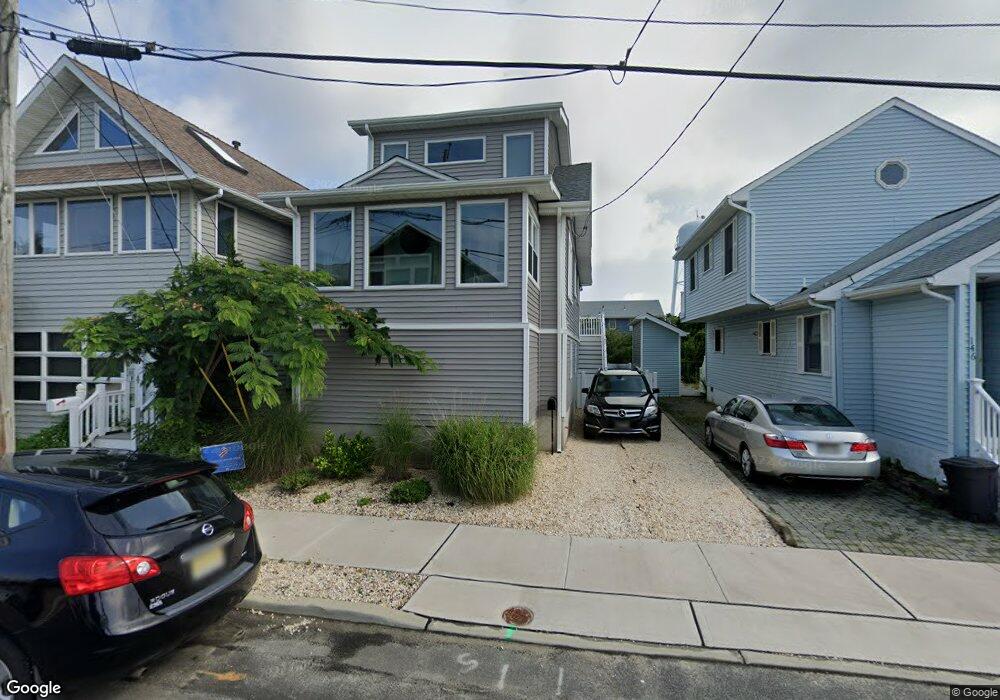
148 O St Seaside Park, NJ 08752
Estimated Value: $606,000 - $756,000
3
Beds
2
Baths
714
Sq Ft
$954/Sq Ft
Est. Value
About This Home
This home is located at 148 O St, Seaside Park, NJ 08752 and is currently estimated at $681,191, approximately $954 per square foot. 148 O St is a home located in Ocean County with nearby schools including Central Regional Middle School and Central Regional High School.
Ownership History
Date
Name
Owned For
Owner Type
Purchase Details
Closed on
Mar 14, 2005
Sold by
Raftery William J and Raftery Triolo Elizabeth
Bought by
Difilippo Genevieve and Bryant Karen
Current Estimated Value
Home Financials for this Owner
Home Financials are based on the most recent Mortgage that was taken out on this home.
Original Mortgage
$320,000
Outstanding Balance
$162,231
Interest Rate
5.61%
Mortgage Type
Purchase Money Mortgage
Estimated Equity
$518,960
Purchase Details
Closed on
Nov 4, 1997
Sold by
Summit Bank
Bought by
Claburri Joseph
Home Financials for this Owner
Home Financials are based on the most recent Mortgage that was taken out on this home.
Original Mortgage
$45,000
Interest Rate
7.17%
Create a Home Valuation Report for This Property
The Home Valuation Report is an in-depth analysis detailing your home's value as well as a comparison with similar homes in the area
Home Values in the Area
Average Home Value in this Area
Purchase History
| Date | Buyer | Sale Price | Title Company |
|---|---|---|---|
| Difilippo Genevieve | $400,000 | -- | |
| Claburri Joseph | $50,000 | -- |
Source: Public Records
Mortgage History
| Date | Status | Borrower | Loan Amount |
|---|---|---|---|
| Open | Difilippo Genevieve | $320,000 | |
| Previous Owner | Claburri Joseph | $45,000 | |
| Closed | Difilippo Genevieve | $40,000 |
Source: Public Records
Tax History Compared to Growth
Tax History
| Year | Tax Paid | Tax Assessment Tax Assessment Total Assessment is a certain percentage of the fair market value that is determined by local assessors to be the total taxable value of land and additions on the property. | Land | Improvement |
|---|---|---|---|---|
| 2025 | $5,422 | $331,400 | $263,000 | $68,400 |
| 2024 | $5,332 | $331,400 | $263,000 | $68,400 |
| 2023 | $5,143 | $331,400 | $263,000 | $68,400 |
| 2022 | $5,143 | $331,400 | $263,000 | $68,400 |
| 2021 | $5,034 | $331,400 | $263,000 | $68,400 |
| 2020 | $4,981 | $331,400 | $263,000 | $68,400 |
| 2019 | $4,928 | $331,400 | $263,000 | $68,400 |
| 2018 | $4,606 | $331,400 | $263,000 | $68,400 |
| 2017 | $4,676 | $331,400 | $263,000 | $68,400 |
| 2016 | $3,899 | $297,200 | $263,000 | $34,200 |
| 2015 | $4,069 | $297,200 | $263,000 | $34,200 |
| 2014 | $3,887 | $297,200 | $263,000 | $34,200 |
Source: Public Records
Map
Nearby Homes
- 139 N St
- 105 O St
- 1409 NE Central Ave
- 121 L St
- 111 K St Unit A2
- 70 K St
- 235 Bay Terrace Unit A
- 235A Bay Terrace Unit A
- 8 Bay Blvd Unit 1
- 1614-1618 Ocean Blvd Unit 18
- 30 N St
- 25 O St
- 3 E Central Ave
- 45-55 Dupont Ave
- 111 Dupont Ave
- 119 Dupont Ave Unit 10
- 1912 Boulevard
- 1 Boulevard Unit G
- 66 I St
- 322 Lincoln Ave