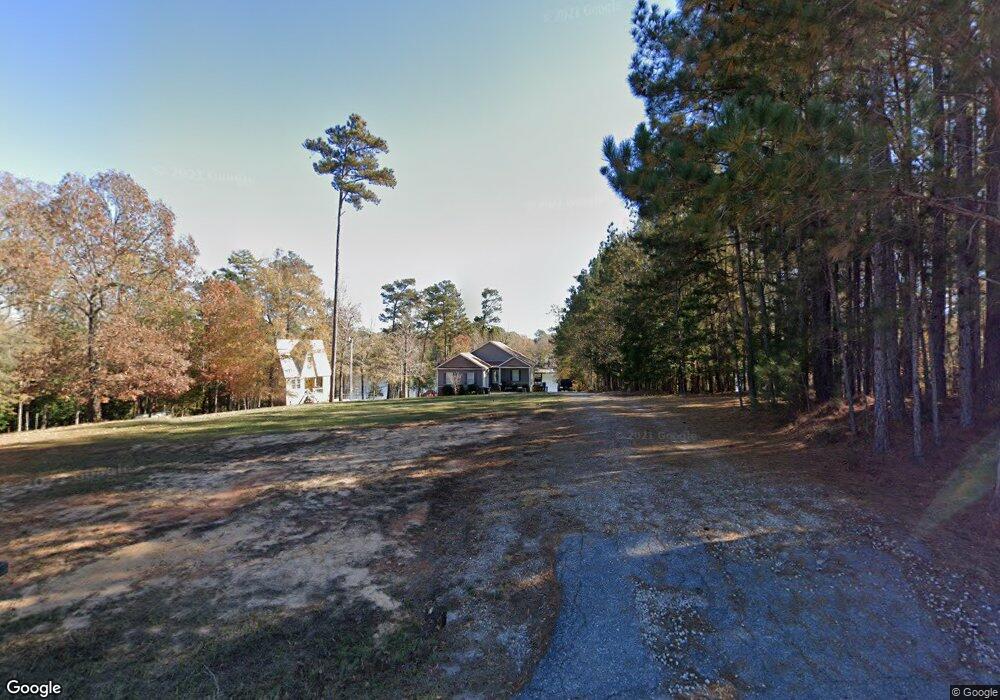
148 Osprey Pointe Ln Prosperity, SC 29127
Estimated Value: $608,000 - $891,000
4
Beds
3
Baths
3,088
Sq Ft
$237/Sq Ft
Est. Value
About This Home
This home is located at 148 Osprey Pointe Ln, Prosperity, SC 29127 and is currently estimated at $730,806, approximately $236 per square foot. 148 Osprey Pointe Ln is a home located in Newberry County with nearby schools including Little Mountain Elementary School, Mid-Carolina Middle School, and Mid-Carolina High School.
Ownership History
Date
Name
Owned For
Owner Type
Purchase Details
Closed on
Oct 29, 2013
Sold by
Santacroce Anthony and Santacrose Cynthia M
Bought by
Griffith Stephen B and Griffith Andrea S
Current Estimated Value
Home Financials for this Owner
Home Financials are based on the most recent Mortgage that was taken out on this home.
Original Mortgage
$355,000
Outstanding Balance
$266,165
Interest Rate
4.52%
Estimated Equity
$464,641
Purchase Details
Closed on
Dec 14, 2012
Sold by
Fadeley Joseph L and Fadeley Laura A
Bought by
Santacroce Anthony and Santacroce Cynthia M
Purchase Details
Closed on
Nov 28, 2006
Sold by
Campbell Steven N
Bought by
Fadeley Joseph L and Fadeley Laura A
Purchase Details
Closed on
Apr 21, 2006
Sold by
Klicka Daniel C and Klicka Katherine S
Bought by
Campbell Steven N
Create a Home Valuation Report for This Property
The Home Valuation Report is an in-depth analysis detailing your home's value as well as a comparison with similar homes in the area
Purchase History
| Date | Buyer | Sale Price | Title Company |
|---|---|---|---|
| Griffith Stephen B | $385,000 | -- | |
| Santacroce Anthony | $110,500 | -- | |
| Fadeley Joseph L | $153,500 | -- | |
| Campbell Steven N | $138,000 | -- |
Source: Public Records
Mortgage History
| Date | Status | Borrower | Loan Amount |
|---|---|---|---|
| Open | Griffith Stephen B | $355,000 |
Source: Public Records
Tax History
| Year | Tax Paid | Tax Assessment Tax Assessment Total Assessment is a certain percentage of the fair market value that is determined by local assessors to be the total taxable value of land and additions on the property. | Land | Improvement |
|---|---|---|---|---|
| 2025 | $3,389 | $18,519 | $4,805 | $13,714 |
| 2024 | $3,059 | $16,104 | $5,096 | $11,008 |
| 2023 | $3,027 | $16,104 | $5,096 | $11,008 |
| 2022 | $2,995 | $16,104 | $5,096 | $11,008 |
| 2021 | $2,904 | $15,532 | $5,096 | $10,436 |
| 2020 | $2,904 | $15,532 | $5,096 | $10,436 |
| 2019 | $8,598 | $23,298 | $7,644 | $15,654 |
| 2018 | $8,771 | $22,962 | $7,644 | $15,318 |
| 2017 | $3,827 | $22,962 | $7,644 | $15,318 |
| 2016 | $2,923 | $15,048 | $5,096 | $9,952 |
| 2015 | -- | $0 | $0 | $0 |
| 2014 | -- | $15,048 | $0 | $0 |
| 2013 | -- | $5,096 | $0 | $0 |
| 2012 | -- | $5,410 | $0 | $0 |
Source: Public Records
Map
Nearby Homes
- 196 Osprey Pointe Ln
- 0 Woodside Shores Dr
- 0 Osprey Pointe Ln Unit 608020
- 0 Lands End Ln Unit 628137
- 0 Lands End Ln Unit 630334
- 0 Lands End Ln Unit 618039
- 0 Lands End Ln Unit 622666
- 0 Lands End Ln Unit 628134
- 0 Lands End Ln Unit 622663
- 0 Lands End Ln Unit 628193
- 0 Lands Ends Ln Unit 622660
- 70 Navigator Trail
- 243 Woodside Shores Dr
- 73 Lands End Ln
- 0 Adventure Bay Unit 623054
- 0 Adventure Bay Unit 624914
- 29 Lands End Ln
- LOT 229 Lands End Ln
- 193 Lands End Ln
- 0 Bridge View Ct Unit 582188
- 162 Osprey Pointe Ln
- 107 Osprey Pointe Ln
- 153 Osprey Pointe Ln
- 178 Osprey Pointe Ln
- 335 Osprey Pointe Ln
- 196 Osprey Pointe Ln
- TBD Osprey Pointe Ln
- 214 Osprey Pointe Ln
- 133 Osprey Pointe Ln
- 255 Osprey Pointe Ln
- 1011 Seagull Ln
- 1027 Seagull Ln
- 293 Osprey Pointe Ln
- 248 Osprey Pointe Ln
- 969 Seagull Ln
- 258 Osprey Pointe Ln
- 1043 Seagull Ln
- 18 Osprey Pointe Ln
- 15 Osprey Pointe Ln
- 7 Osprey Pointe Ln
Your Personal Tour Guide
Ask me questions while you tour the home.