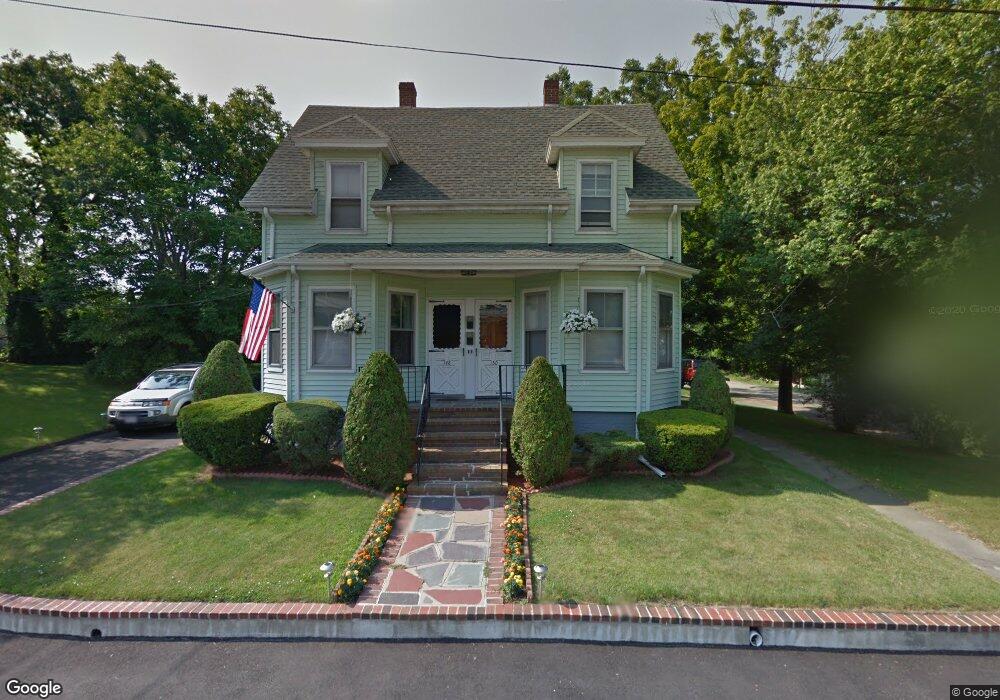
148 Park Rd Brockton, MA 02301
Estimated Value: $633,346 - $765,000
4
Beds
2
Baths
2,280
Sq Ft
$309/Sq Ft
Est. Value
About This Home
This home is located at 148 Park Rd, Brockton, MA 02301 and is currently estimated at $704,587, approximately $309 per square foot. 148 Park Rd is a home located in Plymouth County with nearby schools including Manthala George Jr. School, Louis F Angelo Elementary School, and Raymond K-8 Elementary School.
Ownership History
Date
Name
Owned For
Owner Type
Purchase Details
Closed on
Jan 19, 2011
Sold by
Angelopoulos Darlene M
Bought by
Wheeler Darlene M
Current Estimated Value
Purchase Details
Closed on
May 25, 1989
Sold by
Loveday Ger J Est
Bought by
Angelopoulos John F
Home Financials for this Owner
Home Financials are based on the most recent Mortgage that was taken out on this home.
Original Mortgage
$150,000
Interest Rate
10.99%
Mortgage Type
Purchase Money Mortgage
Create a Home Valuation Report for This Property
The Home Valuation Report is an in-depth analysis detailing your home's value as well as a comparison with similar homes in the area
Home Values in the Area
Average Home Value in this Area
Purchase History
| Date | Buyer | Sale Price | Title Company |
|---|---|---|---|
| Wheeler Darlene M | -- | -- | |
| Angelopoulos John F | $168,500 | -- |
Source: Public Records
Mortgage History
| Date | Status | Borrower | Loan Amount |
|---|---|---|---|
| Previous Owner | Angelopoulos John F | $150,000 |
Source: Public Records
Tax History Compared to Growth
Tax History
| Year | Tax Paid | Tax Assessment Tax Assessment Total Assessment is a certain percentage of the fair market value that is determined by local assessors to be the total taxable value of land and additions on the property. | Land | Improvement |
|---|---|---|---|---|
| 2025 | $7,139 | $589,500 | $145,100 | $444,400 |
| 2024 | $6,861 | $570,800 | $145,100 | $425,700 |
| 2023 | $5,932 | $457,000 | $110,100 | $346,900 |
| 2022 | $6,042 | $432,500 | $100,100 | $332,400 |
| 2021 | $5,691 | $392,500 | $95,100 | $297,400 |
| 2020 | $5,451 | $359,800 | $91,100 | $268,700 |
| 2019 | $5,271 | $339,200 | $85,600 | $253,600 |
| 2018 | $4,932 | $307,100 | $85,600 | $221,500 |
| 2017 | $4,522 | $280,900 | $85,600 | $195,300 |
| 2016 | $4,522 | $260,500 | $77,500 | $183,000 |
| 2015 | $3,202 | $176,400 | $77,500 | $98,900 |
| 2014 | $3,434 | $189,400 | $77,500 | $111,900 |
Source: Public Records
Map
Nearby Homes
- 2 Rochelle St
- 107 Wheeler Ave
- 158 Park Rd
- 158 Park Rd Unit 1
- 158 Park Rd Unit 2
- 113 Wheeler Ave
- 95 Wheeler Ave
- 143 Park Rd
- 147 Park Rd
- 160 Park Rd
- 157 Park Rd
- 157 Park Rd Unit 1
- 61 Sycamore St
- 49 Sycamore St
- 55 Sycamore St
- 55 Sycamore St Unit 1
- 47 Sycamore St
- 89 Wheeler Ave
- 161 Park Rd
- 65 Sycamore St