148 Penn St Hanover, PA 17331
Hanover Historic District NeighborhoodEstimated Value: $1,360,358
Studio
--
Bath
20,140
Sq Ft
$68/Sq Ft
Est. Value
About This Home
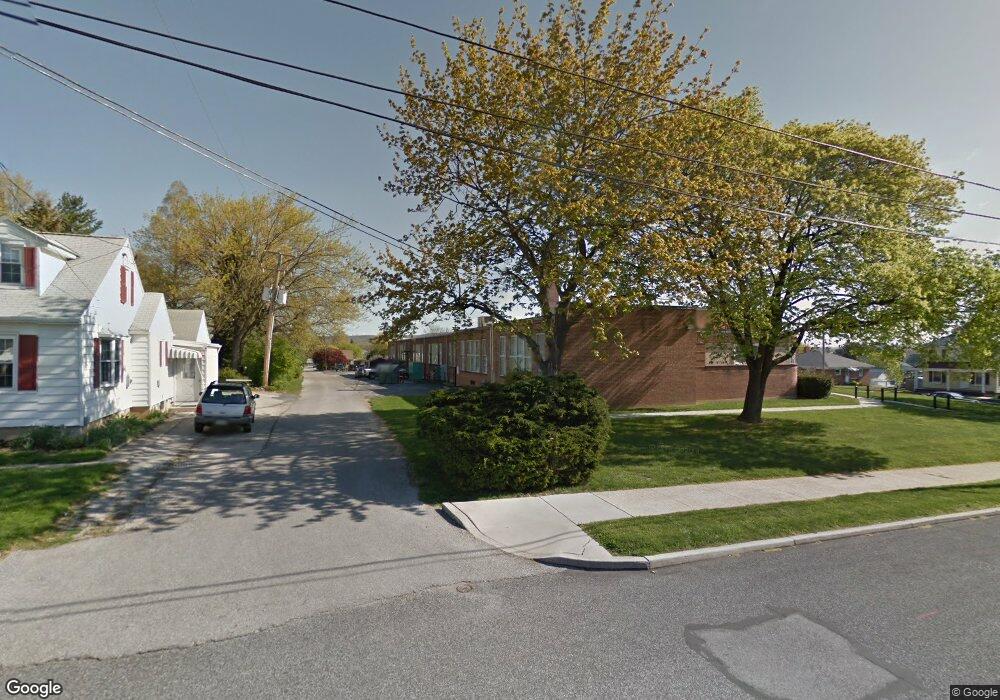
This home is located at 148 Penn St, Hanover, PA 17331 and is currently estimated at $1,360,358, approximately $67 per square foot. 148 Penn St is a home located in York County with nearby schools including Clearview Elementary School, Washington Elementary School, and Hanover Middle School.
Ownership History
Date
Name
Owned For
Owner Type
Purchase Details
Closed on
Nov 8, 2021
Sold by
Packaging Corporation Of America
Bought by
Mcgrew Hq Llc
Current Estimated Value
Home Financials for this Owner
Home Financials are based on the most recent Mortgage that was taken out on this home.
Original Mortgage
$880,000
Outstanding Balance
$806,256
Interest Rate
2.98%
Mortgage Type
Future Advance Clause Open End Mortgage
Estimated Equity
$554,102
Purchase Details
Closed on
Aug 29, 2016
Sold by
Tim Bar Corp
Bought by
Pca Corrugated Nand Display Llc
Purchase Details
Closed on
Jan 3, 1985
Sold by
Penn Street Associates
Bought by
Penn Street Associates
Create a Home Valuation Report for This Property
The Home Valuation Report is an in-depth analysis detailing your home's value as well as a comparison with similar homes in the area
Home Values in the Area
Average Home Value in this Area
Purchase History
| Date | Buyer | Sale Price | Title Company |
|---|---|---|---|
| Mcgrew Hq Llc | $1,100,000 | Lakeside Title Company | |
| Mcgrew Hq Llc | $1,100,000 | None Listed On Document | |
| Pca Corrugated Nand Display Llc | $1,500,000 | None Available | |
| Pennsylvania Corporatin | -- | None Available | |
| Penn Street Associates | -- | -- |
Source: Public Records
Mortgage History
| Date | Status | Borrower | Loan Amount |
|---|---|---|---|
| Open | Mcgrew Hq Llc | $880,000 | |
| Closed | Mcgrew Hq Llc | $880,000 |
Source: Public Records
Tax History
| Year | Tax Paid | Tax Assessment Tax Assessment Total Assessment is a certain percentage of the fair market value that is determined by local assessors to be the total taxable value of land and additions on the property. | Land | Improvement |
|---|---|---|---|---|
| 2025 | $33,169 | $906,000 | $126,280 | $779,720 |
| 2024 | $32,915 | $906,000 | $126,280 | $779,720 |
| 2023 | $32,661 | $906,000 | $126,280 | $779,720 |
| 2022 | $33,624 | $944,220 | $126,280 | $817,940 |
| 2021 | $32,679 | $944,220 | $126,280 | $817,940 |
| 2020 | $32,679 | $944,220 | $126,280 | $817,940 |
| 2019 | $32,170 | $944,220 | $126,280 | $817,940 |
| 2018 | $31,575 | $944,220 | $126,280 | $817,940 |
| 2017 | $30,980 | $944,220 | $126,280 | $817,940 |
| 2016 | $0 | $944,220 | $126,280 | $817,940 |
| 2015 | -- | $944,220 | $126,280 | $817,940 |
| 2014 | -- | $944,220 | $126,280 | $817,940 |
Source: Public Records
Map
Nearby Homes
Your Personal Tour Guide
Ask me questions while you tour the home.