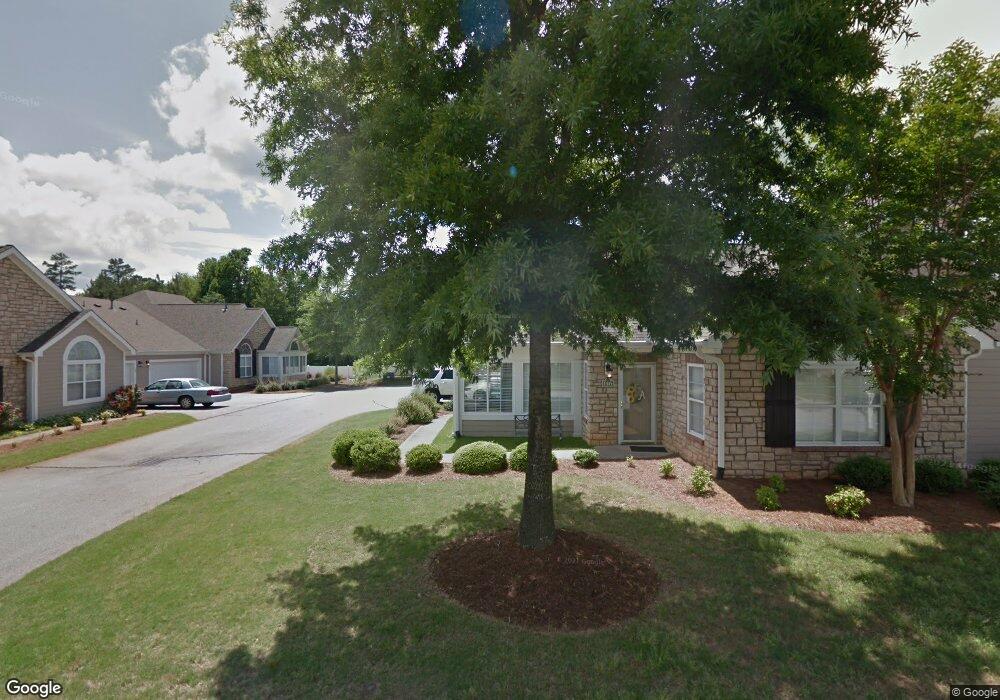
148 Ravines Ln Unit 148 Spartanburg, SC 29301
Estimated Value: $278,000 - $341,000
2
Beds
2
Baths
2,035
Sq Ft
$151/Sq Ft
Est. Value
About This Home
This home is located at 148 Ravines Ln Unit 148, Spartanburg, SC 29301 and is currently estimated at $306,694, approximately $150 per square foot. 148 Ravines Ln Unit 148 is a home located in Spartanburg County with nearby schools including Dorman High School Freshman Campus, Dorman High School, and Fine Arts Preparatory School.
Ownership History
Date
Name
Owned For
Owner Type
Purchase Details
Closed on
Dec 29, 2023
Sold by
Moon Julie F
Bought by
Moon Julie F
Current Estimated Value
Purchase Details
Closed on
Oct 2, 2017
Sold by
Brown Patricia M
Bought by
Moon Anthony T and Moon Julie F
Home Financials for this Owner
Home Financials are based on the most recent Mortgage that was taken out on this home.
Original Mortgage
$129,000
Interest Rate
3.89%
Mortgage Type
New Conventional
Purchase Details
Closed on
Aug 16, 2011
Sold by
Brown Patricia Mclean and Brown Patricia M
Bought by
Brown Patricia M and Patricia M Brown Revocable Trust
Purchase Details
Closed on
Jun 21, 2007
Sold by
The Ravines At Woodridge Llc
Bought by
Brown Patricia Mclean
Home Financials for this Owner
Home Financials are based on the most recent Mortgage that was taken out on this home.
Original Mortgage
$167,920
Interest Rate
6.35%
Mortgage Type
Purchase Money Mortgage
Create a Home Valuation Report for This Property
The Home Valuation Report is an in-depth analysis detailing your home's value as well as a comparison with similar homes in the area
Home Values in the Area
Average Home Value in this Area
Purchase History
| Date | Buyer | Sale Price | Title Company |
|---|---|---|---|
| Moon Julie F | -- | None Listed On Document | |
| Moon Anthony T | $204,000 | None Available | |
| Brown Patricia M | -- | -- | |
| Brown Patricia Mclean | $209,900 | Attorney |
Source: Public Records
Mortgage History
| Date | Status | Borrower | Loan Amount |
|---|---|---|---|
| Previous Owner | Moon Anthony T | $129,000 | |
| Previous Owner | Brown Patricia Mclean | $167,920 |
Source: Public Records
Tax History Compared to Growth
Tax History
| Year | Tax Paid | Tax Assessment Tax Assessment Total Assessment is a certain percentage of the fair market value that is determined by local assessors to be the total taxable value of land and additions on the property. | Land | Improvement |
|---|---|---|---|---|
| 2025 | $1,169 | $8,832 | $781 | $8,051 |
| 2024 | $1,169 | $8,832 | $781 | $8,051 |
| 2023 | $1,169 | $8,832 | $781 | $8,051 |
| 2022 | $1,036 | $7,680 | $800 | $6,880 |
| 2021 | $1,036 | $7,680 | $800 | $6,880 |
| 2020 | $1,010 | $7,680 | $800 | $6,880 |
| 2019 | $1,001 | $7,680 | $800 | $6,880 |
| 2018 | $1,322 | $7,680 | $800 | $6,880 |
| 2017 | $1,540 | $9,188 | $800 | $8,388 |
| 2016 | $1,507 | $9,184 | $800 | $8,384 |
| 2015 | $1,521 | $9,184 | $800 | $8,384 |
| 2014 | $1,474 | $9,184 | $800 | $8,384 |
Source: Public Records
Map
Nearby Homes
- 123 Ravines Ln
- 161 Ravines Ln
- 112 Ravines Ln
- 666 Cozy Bluff Rd
- 226 Longleaf Rd
- Chestnut Plan at Hadden Heights
- Magnolia Plan at Hadden Heights
- 714 Peyden Ln
- 714 Peyden Ln Unit HH 24 Magnolia A
- 710 Peyden Ln
- 720 Peyden Ln
- 720 Peyden Ln Unit HH 21 Chestnut B
- 710 Peyden Ln Unit HH 26 Magnolia A
- 316 Bohler Ln
- 114 Saluda St
- 7 Holly Hill Dr
- 99 Saluda St
- 718 Peyden Ln
- 729 Peyden Ln
- 718 Peyden Ln Unit HH 22 Magnolia A
- 142 Ravines Ln Unit 142
- 146 Ravines Ln Unit 146
- 144 Ravines Ln
- 152 Ravines Ln Unit 152
- 154 Ravines Ln Unit 154
- 158 Ravines Ln Unit 158
- 138 Ravines Ln
- 156 Ravines Ln Unit 156
- 160 Ravines Ln
- 145 Ravines Ln Unit 145
- 134 Ravines Ln
- 130 Ravines Ln
- 140 Ravines Ln
- 153 Ravines Ln Unit 153
- 128 Ravines Ln
- 166 Ravines Ln
- 135 Ravines Ln Unit 135
- 147 Ravines Ln Unit 147
- 141 Ravines Ln Unit 141
- 132 Ravines Ln