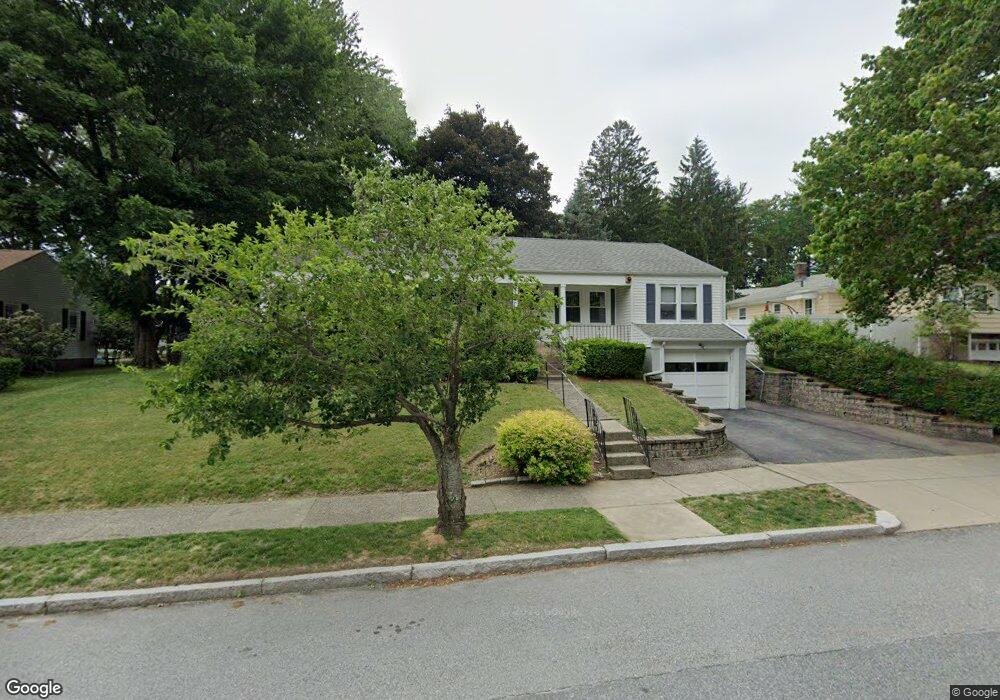
148 S Flagg St Worcester, MA 01602
Newton Square NeighborhoodEstimated Value: $439,000 - $486,000
3
Beds
3
Baths
1,522
Sq Ft
$299/Sq Ft
Est. Value
About This Home
This home is located at 148 S Flagg St, Worcester, MA 01602 and is currently estimated at $455,782, approximately $299 per square foot. 148 S Flagg St is a home located in Worcester County with nearby schools including Chandler Magnet, Jacob Hiatt Magnet School, and May Street Elementary School.
Ownership History
Date
Name
Owned For
Owner Type
Purchase Details
Closed on
Aug 13, 2013
Sold by
Siff Funding and Siff
Bought by
Edward A A and Edward Merna M
Current Estimated Value
Purchase Details
Closed on
Nov 5, 2009
Sold by
Siff Edward A and Siff Merna M
Bought by
Siff 2009 Funding T and Siff
Create a Home Valuation Report for This Property
The Home Valuation Report is an in-depth analysis detailing your home's value as well as a comparison with similar homes in the area
Home Values in the Area
Average Home Value in this Area
Purchase History
| Date | Buyer | Sale Price | Title Company |
|---|---|---|---|
| Edward A A | -- | -- | |
| Edward A A | -- | -- | |
| Siff 2009 Funding T | -- | -- | |
| Siff 2009 Funding T | -- | -- |
Source: Public Records
Mortgage History
| Date | Status | Borrower | Loan Amount |
|---|---|---|---|
| Previous Owner | Siff 2009 Funding T | $25,000 |
Source: Public Records
Tax History
| Year | Tax Paid | Tax Assessment Tax Assessment Total Assessment is a certain percentage of the fair market value that is determined by local assessors to be the total taxable value of land and additions on the property. | Land | Improvement |
|---|---|---|---|---|
| 2025 | $5,347 | $405,400 | $118,300 | $287,100 |
| 2024 | $5,225 | $380,000 | $118,300 | $261,700 |
| 2023 | $5,066 | $353,300 | $102,900 | $250,400 |
| 2022 | $4,504 | $296,100 | $82,300 | $213,800 |
| 2021 | $4,503 | $276,600 | $65,900 | $210,700 |
| 2020 | $4,400 | $258,800 | $65,900 | $192,900 |
| 2019 | $4,135 | $229,700 | $59,300 | $170,400 |
| 2018 | $3,999 | $211,500 | $59,300 | $152,200 |
| 2017 | $4,065 | $211,500 | $59,300 | $152,200 |
| 2016 | $4,011 | $194,600 | $43,400 | $151,200 |
| 2015 | $3,906 | $194,600 | $43,400 | $151,200 |
| 2014 | $3,830 | $196,000 | $43,400 | $152,600 |
Source: Public Records
Map
Nearby Homes
- 16 Sherwood Rd
- 19 Kenilworth Rd
- 73 Moore Ave
- 24 Hadwen Rd
- 9 Fiske St Unit A
- 18 Hadwen Ln
- 4 Hartshorn Ave
- 60 June St
- 33 Carlisle St
- 47R Yarnie Unit 3A
- 47R Yarnie Unit 1B
- 47R Yarnie Unit 2B
- 47R Yarnie Unit 4B
- 47R Yarnie Unit 8B
- 47R Yarnie Unit 5A
- 47R Yarnie Unit 6B
- 47R Yarnie Unit 4A
- 47R Yarnie Unit 1A
- 47R Yarnie Unit 9
- 47R Yarnie Unit 8A
Your Personal Tour Guide
Ask me questions while you tour the home.