Estimated Value: $190,000 - $234,000
Studio
--
Bath
1,332
Sq Ft
$156/Sq Ft
Est. Value
About This Home
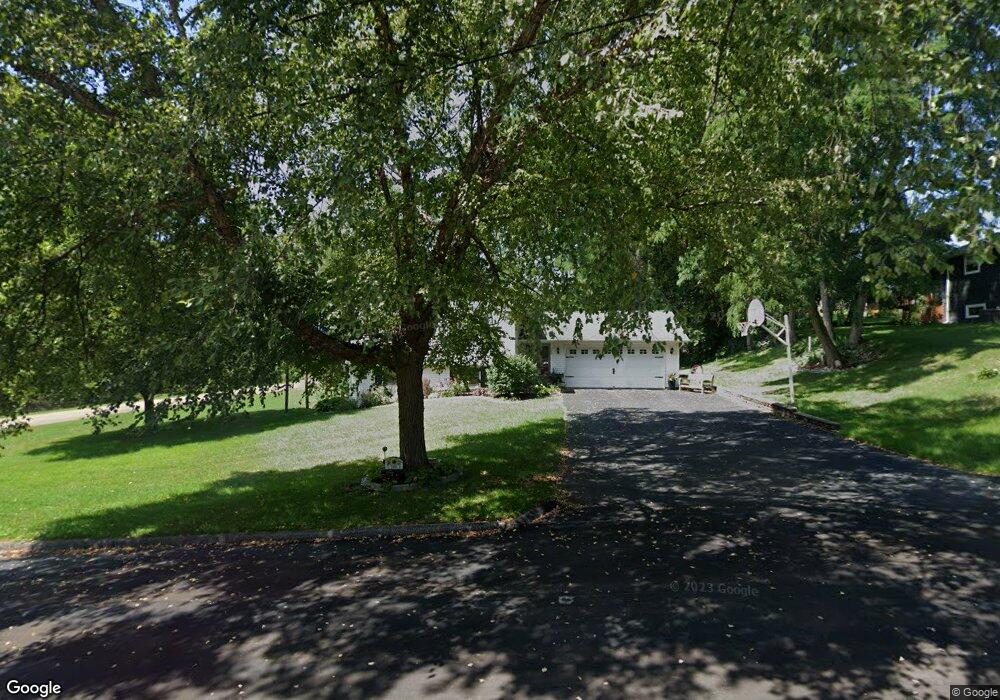
This home is located at 148 S Maple Ave, Byron, IL 61010 and is currently estimated at $207,703, approximately $155 per square foot. 148 S Maple Ave is a home located in Ogle County with nearby schools including Mary Morgan Elementary School, Byron Middle School, and Byron High School.
Create a Home Valuation Report for This Property
The Home Valuation Report is an in-depth analysis detailing your home's value as well as a comparison with similar homes in the area
Home Values in the Area
Average Home Value in this Area
Tax History
| Year | Tax Paid | Tax Assessment Tax Assessment Total Assessment is a certain percentage of the fair market value that is determined by local assessors to be the total taxable value of land and additions on the property. | Land | Improvement |
|---|---|---|---|---|
| 2024 | $4,680 | $60,738 | $12,273 | $48,465 |
| 2023 | $4,362 | $57,741 | $11,667 | $46,074 |
| 2022 | $4,077 | $53,548 | $10,820 | $42,728 |
| 2021 | $3,997 | $51,262 | $10,358 | $40,904 |
| 2020 | $3,677 | $50,257 | $10,155 | $40,102 |
| 2019 | $3,673 | $48,675 | $9,835 | $38,840 |
| 2018 | $3,661 | $47,418 | $9,581 | $37,837 |
| 2017 | $3,623 | $47,418 | $9,581 | $37,837 |
| 2016 | $3,397 | $46,547 | $9,405 | $37,142 |
| 2015 | $3,220 | $45,060 | $9,105 | $35,955 |
| 2014 | $3,185 | $45,060 | $9,105 | $35,955 |
| 2013 | $3,298 | $45,639 | $9,222 | $36,417 |
Source: Public Records
Map
Nearby Homes
- 820 Crest View Trail
- 808 Crest View Trail
- 7424 N River Rd
- 265 Creekside Dr
- 309 Creekside Dr
- 8890 Hales Corner Rd Rd
- 509 N Walnut St
- 1903 Silverthorn Dr
- 617 E 3rd St
- 1245 Glacier Dr
- 1257 Glacier Dr
- 8668 Yosemite Dr
- 713 Birch St
- 1368 Joanne Terrace
- 00 E Ashelford Dr Unit LOT 8
- 00 E Ashelford Dr
- 1269 E Kysor Rd
- 1574 Warrenton Dr
- 2917 Everett Ln
- 6700 N Alpine Dr
- 142 S Maple Ave
- 139 Perene Ave
- 143 S Maple Ave
- 132 S Maple Ave
- 139 S Maple Ave
- 133 Perene Ave
- 135 S Maple Ave
- 128 S Maple Ave
- 1039 River Dr
- 127 Perene Ave
- 1207 River Dr
- 134 Perene Ave
- 127 S Maple Ave
- 122 S Maple Ave
- 131 S Maple Ave
- 128 Perene Ave
- 123 Perene Ave
- 1007 River Dr
- 1007 River Dr
- 246 Sumner St
Your Personal Tour Guide
Ask me questions while you tour the home.