148 Seeno St Monterey, CA 93940
Old Town NeighborhoodEstimated Value: $1,172,000 - $1,258,000
About This Home
This home is located at 148 Seeno St, Monterey, CA 93940 and is currently estimated at $1,217,204, approximately $756 per square foot. 148 Seeno St is a home located in Monterey County with nearby schools including Monte Vista Elementary School, Monte Vista Middle School, and Monterey High School.
Ownership History
We collect this data history from publicly available records. To have your information removed, we recommend requesting removal directly through your county’s website.
Purchase Details
Purchase Details
Purchase Details
Purchase Details
Purchase Details
Home Financials for this Owner
Home Financials are based on the most recent Mortgage that was taken out on this home.Purchase Details
Home Values in the Area
Average Home Value in this Area
Purchase History
We collect this data history from publicly available records. To have your information removed, we recommend requesting removal directly through your county’s website.
| Date | Buyer | Sale Price | Title Company |
|---|---|---|---|
| -- | None Available | ||
| -- | None Available | ||
| -- | None Available | ||
| $695,000 | Stewart Title | ||
| -- | Old Republic Title Company | ||
| $243,500 | Old Republic Title Company | ||
| -- | Old Republic Title Company | ||
| -- | Old Republic Title Company | ||
| $243,776 | First American Title |
Mortgage History
We collect this data history from publicly available records. To have your information removed, we recommend requesting removal directly through your county’s website.
| Date | Status | Borrower | Loan Amount |
|---|---|---|---|
| Previous Owner | $475,000 |
Tax History
We collect this data history from publicly available records. To have your information removed, we recommend requesting removal directly through your county’s website.
| Year | Tax Paid | Tax Assessment Tax Assessment Total Assessment is a certain percentage of the fair market value that is determined by local assessors to be the total taxable value of land and additions on the property. | Land | Improvement |
|---|---|---|---|---|
| 2025 | $9,539 | $887,841 | $473,516 | $414,325 |
| 2024 | $9,539 | $870,433 | $464,232 | $406,201 |
| 2023 | $9,330 | $853,367 | $455,130 | $398,237 |
| 2022 | $9,201 | $836,635 | $446,206 | $390,429 |
| 2021 | $9,068 | $820,231 | $437,457 | $382,774 |
| 2020 | $8,725 | $811,822 | $432,972 | $378,850 |
| 2019 | $9,157 | $795,905 | $424,483 | $371,422 |
| 2018 | $8,791 | $780,300 | $416,160 | $364,140 |
| 2017 | $8,141 | $765,000 | $408,000 | $357,000 |
| 2016 | $7,417 | $695,000 | $400,000 | $295,000 |
| 2015 | $7,316 | $685,000 | $394,000 | $291,000 |
| 2014 | $6,804 | $635,000 | $365,000 | $270,000 |
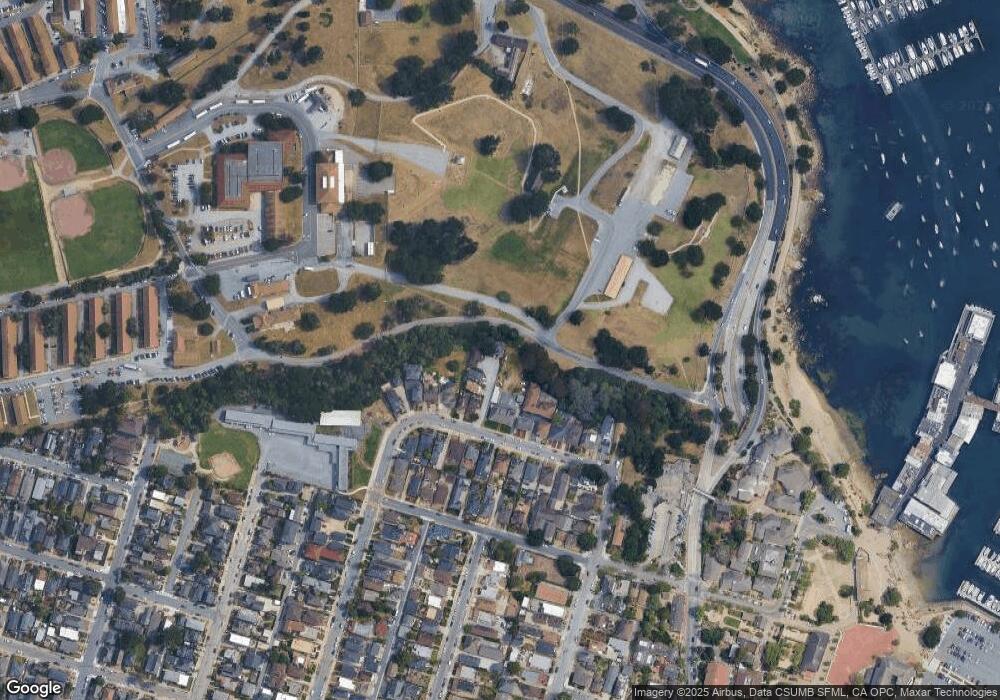
Map
- 318 Clay St
- 928 Hellam St
- 515 Dickman Ave
- 947 W Franklin St
- 336 High St
- 563 Pearl St
- 529 Wave St
- 585 Hawthorne St Unit 103
- 575 Foam St Unit D
- 399 Hoffman Ave
- 600 Oak St
- 1199 Harrison St
- 701 Archer St
- 425 Via Del Rey
- 642 Cypress St
- 590 Perry Ln
- 18 Yerba Buena Ct
- 721 Oak St
- 925 Cass St
- 7 Via Joaquin Unit 5
Ask me questions while you tour the home.