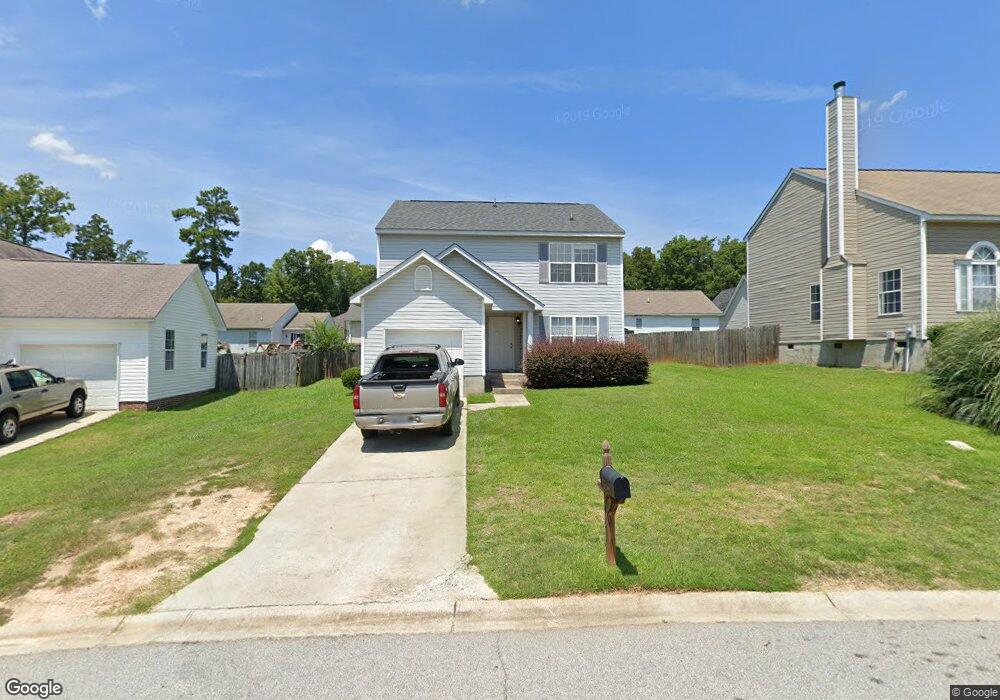
148 Stoney Pointe Dr Chapin, SC 29036
Estimated Value: $239,307 - $288,000
3
Beds
3
Baths
1,731
Sq Ft
$146/Sq Ft
Est. Value
About This Home
This home is located at 148 Stoney Pointe Dr, Chapin, SC 29036 and is currently estimated at $253,577, approximately $146 per square foot. 148 Stoney Pointe Dr is a home located in Lexington County with nearby schools including Chapin Elementary School, Chapin Intermediate, and Chapin High School.
Ownership History
Date
Name
Owned For
Owner Type
Purchase Details
Closed on
Oct 12, 2016
Sold by
Egan James Philip
Bought by
Egan James Philip and Egan Anna V
Current Estimated Value
Purchase Details
Closed on
Nov 4, 2015
Sold by
Simmons Amanda M and Simmons Kevin D
Bought by
Egan James Philip
Purchase Details
Closed on
Dec 15, 2006
Sold by
Sandifer Kathryn Tammy
Bought by
Simmons Amanda M and Simmons Kevin D
Home Financials for this Owner
Home Financials are based on the most recent Mortgage that was taken out on this home.
Original Mortgage
$26,980
Interest Rate
6.19%
Mortgage Type
Purchase Money Mortgage
Purchase Details
Closed on
Aug 28, 2006
Sold by
Nvr Rymarc Homes Of South Carolina Llc
Bought by
Sandifer Kathryn Tammy
Home Financials for this Owner
Home Financials are based on the most recent Mortgage that was taken out on this home.
Original Mortgage
$107,910
Interest Rate
6.67%
Mortgage Type
New Conventional
Purchase Details
Closed on
Apr 24, 2006
Sold by
Mikell David G
Bought by
Nvr Rymarc Homes Of South Carolina Llc
Create a Home Valuation Report for This Property
The Home Valuation Report is an in-depth analysis detailing your home's value as well as a comparison with similar homes in the area
Home Values in the Area
Average Home Value in this Area
Purchase History
| Date | Buyer | Sale Price | Title Company |
|---|---|---|---|
| Egan James Philip | -- | Attorney | |
| Egan James Philip | $115,000 | None Available | |
| Simmons Amanda M | $134,900 | None Available | |
| Sandifer Kathryn Tammy | $119,900 | None Available | |
| Nvr Rymarc Homes Of South Carolina Llc | $18,000 | None Available |
Source: Public Records
Mortgage History
| Date | Status | Borrower | Loan Amount |
|---|---|---|---|
| Previous Owner | Simmons Amanda M | $26,980 | |
| Previous Owner | Sandifer Kathryn Tammy | $107,910 |
Source: Public Records
Tax History Compared to Growth
Tax History
| Year | Tax Paid | Tax Assessment Tax Assessment Total Assessment is a certain percentage of the fair market value that is determined by local assessors to be the total taxable value of land and additions on the property. | Land | Improvement |
|---|---|---|---|---|
| 2024 | $3,816 | $7,935 | $1,367 | $6,568 |
| 2023 | $3,440 | $7,935 | $1,367 | $6,568 |
| 2020 | $3,332 | $7,935 | $1,367 | $6,568 |
| 2019 | $2,988 | $6,900 | $1,200 | $5,700 |
| 2018 | $2,850 | $6,900 | $1,200 | $5,700 |
| 2017 | $2,827 | $6,900 | $1,200 | $5,700 |
| 2016 | $2,807 | $6,900 | $1,200 | $5,700 |
| 2015 | $2,793 | $6,591 | $1,200 | $5,391 |
| 2014 | $2,793 | $7,159 | $1,200 | $5,959 |
| 2013 | -- | $7,160 | $1,200 | $5,960 |
Source: Public Records
Map
Nearby Homes
- 100 Palm St
- 117 Bay Front Dr
- 510 Lilypad Ct
- 0 Dreher Island Rd Unit 21647709
- 0 Dreher Island Rd Unit 587193
- 409 Dutchman Shores Cir
- 3006 Chilmark Rd
- 161 Dutchman Shores Cir
- 147 Ventnor Ave
- 108 Pennsylvania Ct
- 100 Baltic Ct
- 540 Lakeshore Dr
- 814 Dutchmaster Dr
- 1431 Saugus Ct
- 125 Northshore Dr
- 368 Frick Ct
- 908 Old Lexington Hwy
- 147 Stuck's Point
- 417 Northshore Ct
- 412 Northshore Ct
- 152 Stoney Pointe Dr
- 232 Stoney Pointe Dr
- 236 Stoney Pointe Dr
- 228 Stoney Pointe Dr
- 224 Stoney Pointe Dr
- 160 Stoney Pointe Dr
- 156 Stoney Pointe Dr
- 136 Stoney Pointe Dr
- 240 Stoney Pointe Dr
- 155 Stoney Pointe Dr
- 159 Stoney Pointe Dr
- 147 Stoney Pointe Dr
- 128 Stoney Pointe Dr
- 164 Stoney Pointe Dr
- 163 Stoney Pointe Dr
- 245 Stoney Pointe Dr
- 124 Stoney Pointe Dr
- 249 Stoney Pointe Dr
- 139 Stoney Pointe Dr
- 241 Stoney Pointe Dr