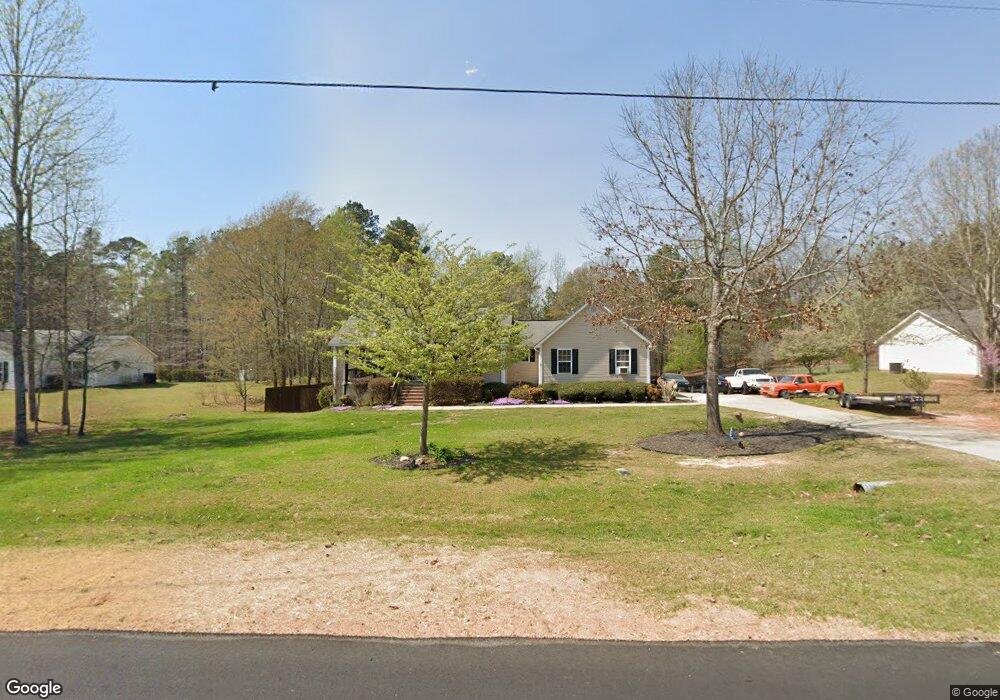
148 Strong Rd Newnan, GA 30263
Estimated Value: $417,000 - $500,000
4
Beds
3
Baths
3,325
Sq Ft
$137/Sq Ft
Est. Value
About This Home
This home is located at 148 Strong Rd, Newnan, GA 30263 and is currently estimated at $456,499, approximately $137 per square foot. 148 Strong Rd is a home located in Coweta County with nearby schools including Western Elementary School, Evans Middle School, and Newnan High School.
Ownership History
Date
Name
Owned For
Owner Type
Purchase Details
Closed on
Jan 28, 2010
Sold by
Aurora Ln Svcs Llc
Bought by
Pearson Shirley S
Current Estimated Value
Home Financials for this Owner
Home Financials are based on the most recent Mortgage that was taken out on this home.
Original Mortgage
$123,300
Interest Rate
4.94%
Mortgage Type
New Conventional
Purchase Details
Closed on
Sep 1, 2009
Sold by
Ronig David R
Bought by
Aurora Ln Svcs Llc
Purchase Details
Closed on
Jun 15, 2005
Sold by
Mackenzie Wood Inc
Bought by
Steve Cochran Const
Home Financials for this Owner
Home Financials are based on the most recent Mortgage that was taken out on this home.
Original Mortgage
$155,000
Interest Rate
5.66%
Mortgage Type
Purchase Money Mortgage
Purchase Details
Closed on
Jul 10, 2002
Sold by
Odom Horace Parnell
Bought by
Mackenzie Woods Inc
Create a Home Valuation Report for This Property
The Home Valuation Report is an in-depth analysis detailing your home's value as well as a comparison with similar homes in the area
Home Values in the Area
Average Home Value in this Area
Purchase History
| Date | Buyer | Sale Price | Title Company |
|---|---|---|---|
| Pearson Shirley S | $137,000 | -- | |
| Aurora Ln Svcs Llc | $197,989 | -- | |
| Aurora Loan Services Llc | $198,000 | -- | |
| Steve Cochran Const | $28,500 | -- | |
| Mackenzie Woods Inc | -- | -- |
Source: Public Records
Mortgage History
| Date | Status | Borrower | Loan Amount |
|---|---|---|---|
| Closed | Pearson Shirley S | $123,300 | |
| Previous Owner | Steve Cochran Const | $155,000 |
Source: Public Records
Tax History Compared to Growth
Tax History
| Year | Tax Paid | Tax Assessment Tax Assessment Total Assessment is a certain percentage of the fair market value that is determined by local assessors to be the total taxable value of land and additions on the property. | Land | Improvement |
|---|---|---|---|---|
| 2025 | $3,562 | $155,610 | $20,000 | $135,610 |
| 2024 | $3,564 | $158,112 | $20,000 | $138,112 |
| 2023 | $3,564 | $119,671 | $20,000 | $99,671 |
| 2022 | $2,682 | $113,562 | $20,000 | $93,562 |
| 2021 | $2,396 | $95,680 | $14,000 | $81,680 |
| 2020 | $2,411 | $95,680 | $14,000 | $81,680 |
| 2019 | $2,027 | $74,064 | $10,000 | $64,064 |
| 2018 | $2,031 | $74,064 | $10,000 | $64,064 |
| 2017 | $1,718 | $63,386 | $10,000 | $53,386 |
| 2016 | $1,836 | $63,386 | $10,000 | $53,386 |
| 2015 | $1,622 | $56,980 | $10,000 | $46,980 |
| 2014 | $1,609 | $56,980 | $10,000 | $46,980 |
Source: Public Records
Map
Nearby Homes
- 450 Mckoy Rd
- 731 Summers McKoy Rd
- 97 Welcome Wood Dr
- 2058 Welcome Rd
- 0 Mount Carmel Rd Unit 10498073
- 92 Twelve Springs Dr
- 134 Rustica Dr
- 198 Austin Storey Cir
- 114 Austin Storey Cir
- 493 Boone Rd
- 2 Mount Carmel Rd
- 0 Margarita Trail Unit 10555337
- 0 Margarita Trail Unit 7607851
- 466 Austin Storey Cir
- 1428 Welcome Rd
- 83 Wagers Mill Rd
- 606 Welcome Sargent Rd
- 0 Welcome To Arnco Rd Unit 10350112
- 354 Turner Rd
- 1268 Welcome Rd