148 Trace Ln Fitzgerald, GA 31750
Estimated Value: $148,000 - $201,000
3
Beds
2
Baths
1,242
Sq Ft
$132/Sq Ft
Est. Value
About This Home
This home is located at 148 Trace Ln, Fitzgerald, GA 31750 and is currently estimated at $164,525, approximately $132 per square foot. 148 Trace Ln is a home located in Ben Hill County with nearby schools including Ben Hill County Primary School, Ben Hill Elementary School, and Ben Hill County Middle School.
Ownership History
Date
Name
Owned For
Owner Type
Purchase Details
Closed on
Jul 20, 2012
Sold by
Zero Down Investments Llc
Bought by
Jenkins Darrell
Current Estimated Value
Home Financials for this Owner
Home Financials are based on the most recent Mortgage that was taken out on this home.
Original Mortgage
$71,428
Outstanding Balance
$48,440
Interest Rate
3.68%
Mortgage Type
New Conventional
Estimated Equity
$116,085
Purchase Details
Closed on
Nov 3, 2011
Sold by
Bond Jamie Aaron
Bought by
Zero Down Investments Llc
Home Financials for this Owner
Home Financials are based on the most recent Mortgage that was taken out on this home.
Original Mortgage
$50,000
Interest Rate
4.02%
Mortgage Type
Future Advance Clause Open End Mortgage
Purchase Details
Closed on
Aug 6, 2003
Sold by
Summa Builders Inc
Bought by
Bond Jamie Aaron
Purchase Details
Closed on
Dec 26, 1999
Sold by
Alan Paulk Etal
Bought by
Summa Inc
Create a Home Valuation Report for This Property
The Home Valuation Report is an in-depth analysis detailing your home's value as well as a comparison with similar homes in the area
Purchase History
| Date | Buyer | Sale Price | Title Company |
|---|---|---|---|
| Jenkins Darrell | $70,000 | -- | |
| Zero Down Investments Llc | $40,000 | -- | |
| Bond Jamie Aaron | $77,000 | -- | |
| Summa Builders Inc | -- | -- | |
| Summa Inc | -- | -- |
Source: Public Records
Mortgage History
| Date | Status | Borrower | Loan Amount |
|---|---|---|---|
| Open | Jenkins Darrell | $71,428 | |
| Previous Owner | Zero Down Investments Llc | $50,000 |
Source: Public Records
Tax History
| Year | Tax Paid | Tax Assessment Tax Assessment Total Assessment is a certain percentage of the fair market value that is determined by local assessors to be the total taxable value of land and additions on the property. | Land | Improvement |
|---|---|---|---|---|
| 2025 | $1,852 | $43,694 | $3,200 | $40,494 |
| 2024 | $1,840 | $43,132 | $3,200 | $39,932 |
| 2023 | $1,234 | $40,238 | $3,200 | $37,038 |
| 2022 | $1,153 | $34,854 | $3,200 | $31,654 |
| 2021 | $1,156 | $33,648 | $3,200 | $30,448 |
| 2020 | $1,010 | $29,049 | $3,200 | $25,849 |
| 2019 | $1,006 | $29,049 | $3,200 | $25,849 |
| 2018 | $1,246 | $28,911 | $3,200 | $25,711 |
| 2017 | $1,006 | $28,910 | $3,200 | $25,710 |
| 2016 | $963 | $28,978 | $3,200 | $25,778 |
| 2015 | -- | $29,759 | $3,200 | $26,559 |
| 2014 | -- | $31,176 | $3,200 | $27,976 |
Source: Public Records
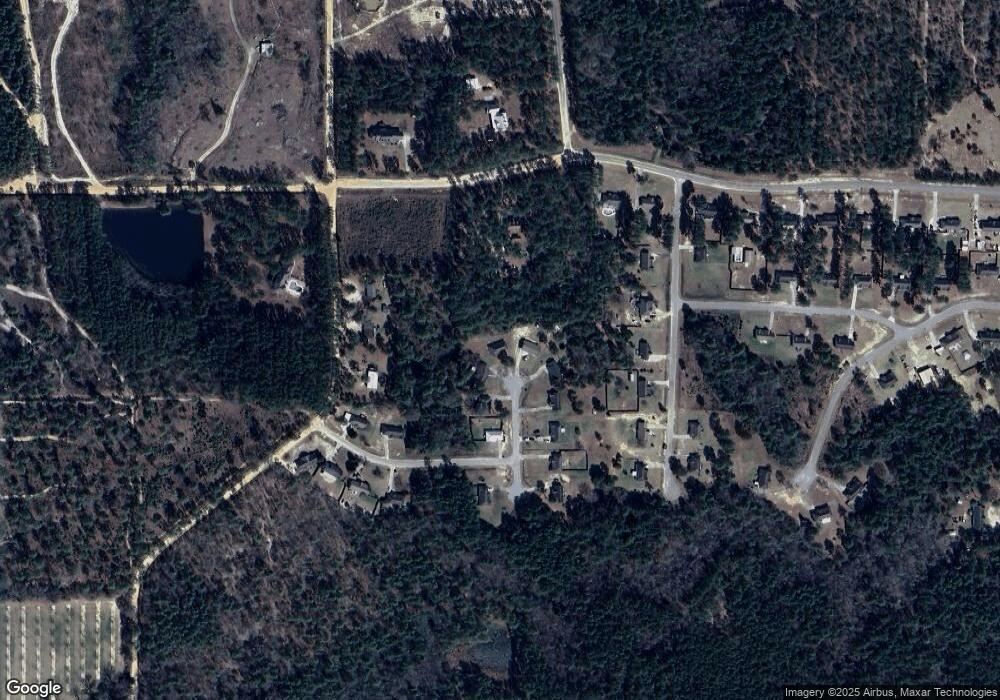
Map
Nearby Homes
- 103 Lexi Ln
- 117 Russell Rd
- 342 Lower Rebecca Rd
- 0 Greer Cir
- 111 Greer Cir
- 1095 N Merrimac Drive Extension
- 0 Thelma Ln
- 0 Westwood Dr
- 165 Bethlehem Church Rd
- 251 Dewey McGlamry Rd
- 131 Carol Cir
- 237 Dewey McGlamry Rd
- 103 Meadowood Ln
- 123 Preston Dr
- 117 Lower Rebecca Rd
- 117 Lower Rebecca Rd Unit 298-4
- 130 Meadowood Ln
- 110 Preston Dr
- 100 Strawberry Ct
- 196 Wilson Ave
Your Personal Tour Guide
Ask me questions while you tour the home.