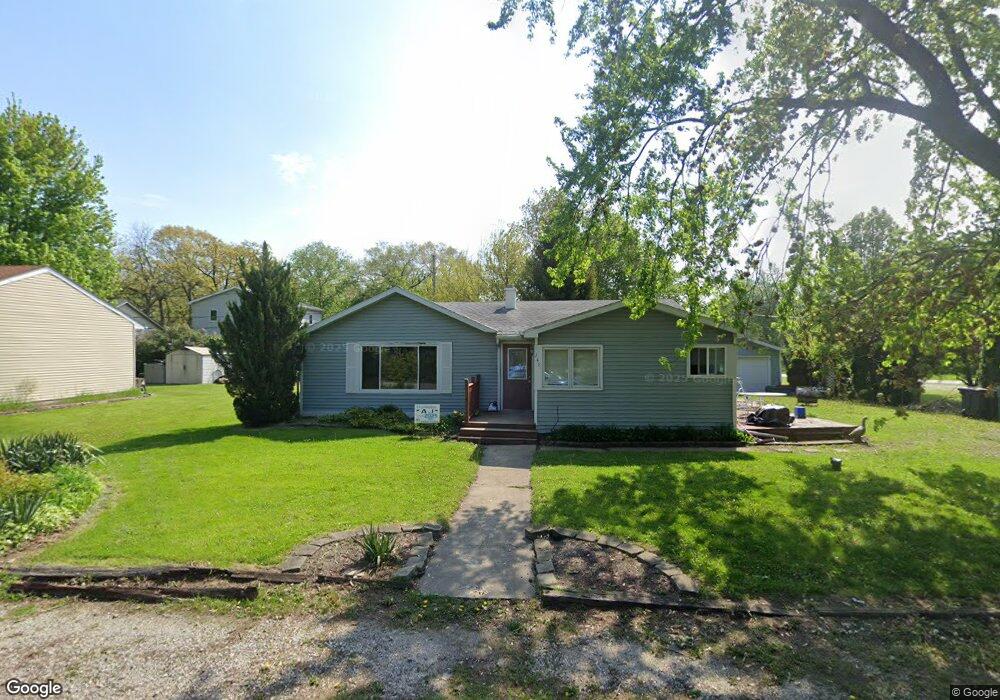
148 Turtle St Shorewood, IL 60404
Estimated Value: $206,000 - $239,000
--
Bed
--
Bath
1,328
Sq Ft
$163/Sq Ft
Est. Value
About This Home
This home is located at 148 Turtle St, Shorewood, IL 60404 and is currently estimated at $216,834, approximately $163 per square foot. 148 Turtle St is a home located in Will County with nearby schools including Shorewood Elementary School, Troy Middle School, and Orenic Intermediate School.
Ownership History
Date
Name
Owned For
Owner Type
Purchase Details
Closed on
Sep 23, 2009
Sold by
Fannie Mae
Bought by
Andrzej T Pieniazek Revocable Living Tru
Current Estimated Value
Purchase Details
Closed on
Mar 5, 2009
Sold by
Price Beth
Bought by
Federal National Mortgage Association
Purchase Details
Closed on
Jun 8, 2001
Sold by
Price George A
Bought by
Price Beth
Home Financials for this Owner
Home Financials are based on the most recent Mortgage that was taken out on this home.
Original Mortgage
$145,500
Interest Rate
7.2%
Purchase Details
Closed on
Sep 25, 1998
Sold by
Clark Leah O and Clark Leah
Bought by
Price George A and Price Beth A
Home Financials for this Owner
Home Financials are based on the most recent Mortgage that was taken out on this home.
Original Mortgage
$84,000
Interest Rate
11.25%
Create a Home Valuation Report for This Property
The Home Valuation Report is an in-depth analysis detailing your home's value as well as a comparison with similar homes in the area
Home Values in the Area
Average Home Value in this Area
Purchase History
| Date | Buyer | Sale Price | Title Company |
|---|---|---|---|
| Andrzej T Pieniazek Revocable Living Tru | $92,555 | First American Title | |
| Federal National Mortgage Association | $161,694 | None Available | |
| Price Beth | -- | Prairie Title | |
| Price George A | $60,000 | Law Title Pick Up |
Source: Public Records
Mortgage History
| Date | Status | Borrower | Loan Amount |
|---|---|---|---|
| Previous Owner | Price Beth | $145,500 | |
| Previous Owner | Price George A | $84,000 |
Source: Public Records
Tax History Compared to Growth
Tax History
| Year | Tax Paid | Tax Assessment Tax Assessment Total Assessment is a certain percentage of the fair market value that is determined by local assessors to be the total taxable value of land and additions on the property. | Land | Improvement |
|---|---|---|---|---|
| 2024 | $4,076 | $49,173 | $6,778 | $42,395 |
| 2023 | $4,076 | $42,367 | $6,090 | $36,277 |
| 2022 | $3,655 | $40,090 | $5,763 | $34,327 |
| 2021 | $3,281 | $37,714 | $5,421 | $32,293 |
| 2020 | $2,668 | $30,597 | $5,421 | $25,176 |
| 2019 | $2,595 | $29,350 | $5,200 | $24,150 |
| 2018 | $2,144 | $23,583 | $4,733 | $18,850 |
| 2017 | $1,907 | $20,601 | $4,733 | $15,868 |
| 2016 | $1,743 | $18,183 | $4,733 | $13,450 |
| 2015 | $806 | $14,133 | $4,133 | $10,000 |
| 2014 | $806 | $10,633 | $4,133 | $6,500 |
| 2013 | $806 | $8,513 | $4,133 | $4,380 |
Source: Public Records
Map
Nearby Homes
- 704 Helene St Unit 1
- 202 Diana St
- 201 Oakwood Dr
- 104 Dante Ct
- 324 Parkshore Dr
- 4439 Timber Ridge Ct Unit 110C
- 4313 Timber Ridge Ct
- 4319 Timber Ridge Ct
- 313 Louisa St N
- 1007 Windsor Dr
- 741 River Bluff Dr
- 1 AC Jefferson St
- 00001 Jefferson St
- 00002 Jefferson St
- 1204 Glen Mor Dr Unit B
- 515 David Dr
- 519 Sean Dr
- 1111 Country Dr
- 24614 Kaylee St
- 20400 Rock Run Dr
- 149 Turtle St
- 153 Turtle St
- 153 Turtle St
- 143 Picnic St
- 502 Westshore Dr
- 142 Turtle St
- 146 Turtle St
- 141 Picnic St
- 141 Turtle St
- 604 Westshore Dr
- 404 Garden Terrace
- 402 Garden Terrace
- 416 Westshore Dr
- 140 Turtle St
- 139 Picnic St
- 406 Garden Terrace
- 400 Garden Terrace
- 310 Garden Terrace
- 408 Garden Terrace
- 137 Picnic St