Estimated Value: $197,000 - $251,000
3
Beds
2
Baths
3,032
Sq Ft
$73/Sq Ft
Est. Value
About This Home
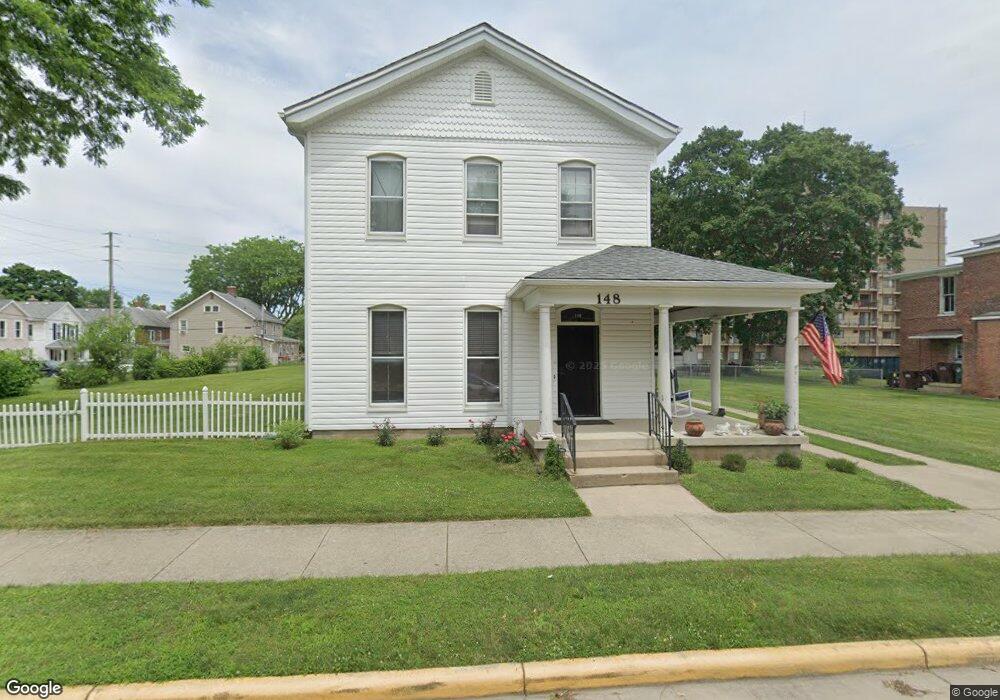
This home is located at 148 W 3rd St, Xenia, OH 45385 and is currently estimated at $221,618, approximately $73 per square foot. 148 W 3rd St is a home located in Greene County with nearby schools including Xenia High School, Summit Academy Community School for Alternative Learners - Xenia, and Legacy Christian Academy.
Ownership History
Date
Name
Owned For
Owner Type
Purchase Details
Closed on
Nov 18, 2021
Sold by
Carnes Jennifer and Estate Of Marjorie Jane Kyle
Bought by
Araujo Daniel Mark and Araujo Diana
Current Estimated Value
Home Financials for this Owner
Home Financials are based on the most recent Mortgage that was taken out on this home.
Original Mortgage
$72,000
Outstanding Balance
$65,966
Interest Rate
2.98%
Mortgage Type
New Conventional
Estimated Equity
$155,652
Purchase Details
Closed on
Jun 10, 2014
Sold by
Sherrets Carl D
Bought by
Kyle Mariorie J
Create a Home Valuation Report for This Property
The Home Valuation Report is an in-depth analysis detailing your home's value as well as a comparison with similar homes in the area
Home Values in the Area
Average Home Value in this Area
Purchase History
| Date | Buyer | Sale Price | Title Company |
|---|---|---|---|
| Araujo Daniel Mark | $90,000 | None Available | |
| Kyle Mariorie J | -- | None Available |
Source: Public Records
Mortgage History
| Date | Status | Borrower | Loan Amount |
|---|---|---|---|
| Open | Araujo Daniel Mark | $72,000 |
Source: Public Records
Tax History Compared to Growth
Tax History
| Year | Tax Paid | Tax Assessment Tax Assessment Total Assessment is a certain percentage of the fair market value that is determined by local assessors to be the total taxable value of land and additions on the property. | Land | Improvement |
|---|---|---|---|---|
| 2024 | $2,302 | $65,020 | $4,910 | $60,110 |
| 2023 | $2,302 | $65,020 | $4,910 | $60,110 |
| 2022 | $2,448 | $48,790 | $3,920 | $44,870 |
| 2021 | $2,481 | $48,790 | $3,920 | $44,870 |
| 2020 | $1,580 | $48,790 | $3,920 | $44,870 |
| 2019 | $1,078 | $30,150 | $4,070 | $26,080 |
| 2018 | $1,083 | $30,150 | $4,070 | $26,080 |
| 2017 | $1,097 | $30,150 | $4,070 | $26,080 |
| 2016 | $1,098 | $30,050 | $4,070 | $25,980 |
| 2015 | $464 | $30,050 | $4,070 | $25,980 |
| 2014 | -- | $30,050 | $4,070 | $25,980 |
Source: Public Records
Map
Nearby Homes