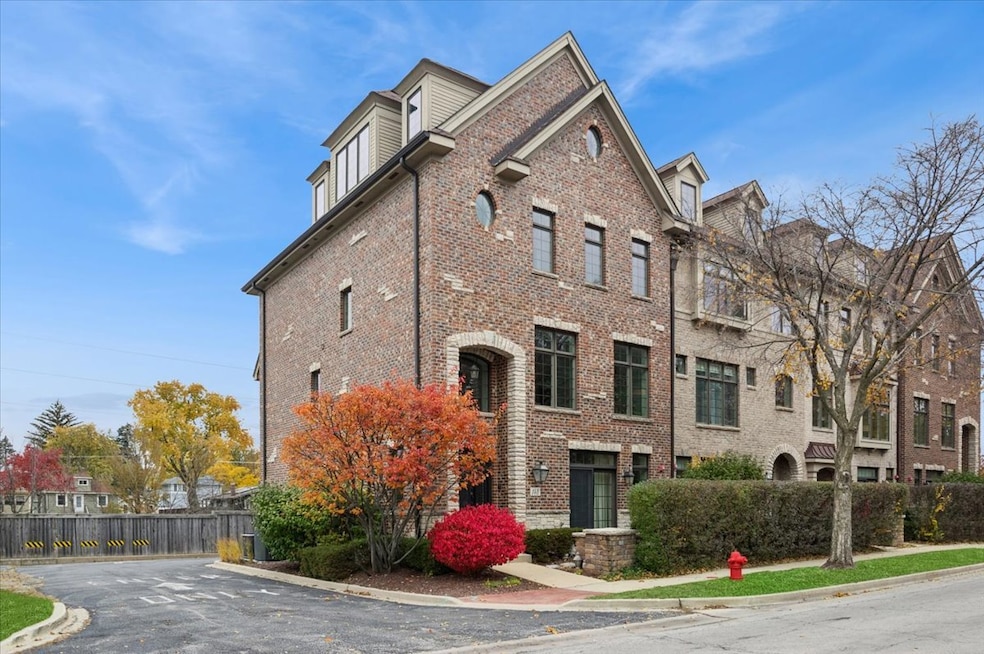


148 W Quincy St Westmont, IL 60559
South Westmont NeighborhoodEstimated payment $4,685/month
Highlights
- Wood Flooring
- Loft
- Granite Countertops
- J T Manning Elementary School Rated A-
- End Unit
- 4-minute walk to Lebeck Park
About This Home
Timeless sophistication and everyday convenience meet in this sun-filled, four-story end-unit townhouse with attached two-car garage situated in the heart of downtown Westmont. The thoughtfully designed floor plan showcases 10-foot ceilings with crown molding, rich hardwood flooring, and sound-deadening construction throughout. A gourmet kitchenboasts custom cabinetry, granite countertops, and stainless-steel appliances-perfect for both everyday living and effortless entertaining. The inviting family room, centered around a cozy gas-log fireplace, offers the ideal space to relax and unwind. Upstairs, the primary suite provides a private retreat with a luxurious bath featuring a double vanity, separate shower, soaking tub, and two spacious closets-conveniently connected to an adjacent laundry room. The second bedroom includes its own full en suite bath, while the fourth level offers a third generous bedroom, full bath, and a flexible loft that can used as an office or living space and can easily convert into a fourth bedroom. The unfinished basement presents endless possibilities-a home theater, exercise studio, or guest suite-with plumbing already in place for an additional bathroom. Plus attached two-car garage is freshly outfitted with a charger for an electric vehicle. Recent upgrades include a new two-step AC/HVAC system installed in June 2024 and an EV charger for one vehicle in the garage. Ideally located near the METRA commuter station and vibrant downtown amenities.
Listing Agent
@properties Christie's International Real Estate License #475163406 Listed on: 11/12/2025

Townhouse Details
Home Type
- Townhome
Est. Annual Taxes
- $10,088
Year Built
- Built in 2006
Lot Details
- End Unit
HOA Fees
- $225 Monthly HOA Fees
Parking
- 2 Car Garage
- Driveway
- Parking Included in Price
Home Design
- Entry on the 1st floor
- Brick Exterior Construction
- Asphalt Roof
- Concrete Perimeter Foundation
Interior Spaces
- 3,245 Sq Ft Home
- 4-Story Property
- Ceiling Fan
- Gas Log Fireplace
- Window Screens
- Family Room with Fireplace
- Living Room
- Formal Dining Room
- Home Office
- Loft
- Storage
- Laundry Room
- Second Floor Utility Room
Kitchen
- Range
- Microwave
- Dishwasher
- Granite Countertops
- Disposal
Flooring
- Wood
- Carpet
Bedrooms and Bathrooms
- 3 Bedrooms
- 3 Potential Bedrooms
- Walk-In Closet
- Dual Sinks
- Soaking Tub
- Separate Shower
Basement
- Basement Fills Entire Space Under The House
- Sump Pump
- Finished Basement Bathroom
Home Security
Outdoor Features
- Balcony
- Patio
Schools
- J T Manning Elementary School
- Westmont Junior High School
- Westmont High School
Utilities
- Forced Air Heating and Cooling System
- Heating System Uses Natural Gas
- 200+ Amp Service
- Lake Michigan Water
- Cable TV Available
Community Details
Overview
- Association fees include insurance, lawn care, snow removal
- 4 Units
- Management Association, Phone Number (312) 555-1212
- Plan A
Pet Policy
- Dogs and Cats Allowed
Security
- Carbon Monoxide Detectors
- Fire Sprinkler System
Map
Home Values in the Area
Average Home Value in this Area
Tax History
| Year | Tax Paid | Tax Assessment Tax Assessment Total Assessment is a certain percentage of the fair market value that is determined by local assessors to be the total taxable value of land and additions on the property. | Land | Improvement |
|---|---|---|---|---|
| 2024 | $10,088 | $163,214 | $32,634 | $130,580 |
| 2023 | $9,533 | $150,040 | $30,000 | $120,040 |
| 2022 | $9,325 | $145,530 | $29,100 | $116,430 |
| 2021 | $8,962 | $143,880 | $28,770 | $115,110 |
| 2020 | $8,775 | $141,030 | $28,200 | $112,830 |
| 2019 | $8,476 | $135,320 | $27,060 | $108,260 |
| 2018 | $8,431 | $131,380 | $26,270 | $105,110 |
| 2017 | $8,206 | $126,420 | $25,280 | $101,140 |
| 2016 | $8,073 | $120,660 | $24,130 | $96,530 |
| 2015 | $7,940 | $113,520 | $22,700 | $90,820 |
| 2014 | $10,033 | $137,960 | $27,590 | $110,370 |
| 2013 | $9,456 | $137,310 | $27,460 | $109,850 |
Property History
| Date | Event | Price | List to Sale | Price per Sq Ft |
|---|---|---|---|---|
| 11/17/2025 11/17/25 | Pending | -- | -- | -- |
| 11/12/2025 11/12/25 | For Sale | $690,000 | -- | $213 / Sq Ft |
Purchase History
| Date | Type | Sale Price | Title Company |
|---|---|---|---|
| Warranty Deed | $410,000 | First American Title |
Mortgage History
| Date | Status | Loan Amount | Loan Type |
|---|---|---|---|
| Open | $328,000 | New Conventional |
Source: Midwest Real Estate Data (MRED)
MLS Number: 12499715
APN: 09-09-226-037
Disclaimer: Certain information contained herein is derived from information provided by parties other than Homes.com. All information provided is deemed reliable, but is not guaranteed to be accurate and should be independently verified.
![]() Based on information submitted to the MLS GRID. All data is obtained from various sources and may not have been verified by broker or MLS GRID. Supplied Open House Information is subject to change without notice. All information should be independently reviewed and verified for accuracy. Properties may or may not be listed by the office/agent presenting the information. Some IDX listings have been excluded from this website.
Based on information submitted to the MLS GRID. All data is obtained from various sources and may not have been verified by broker or MLS GRID. Supplied Open House Information is subject to change without notice. All information should be independently reviewed and verified for accuracy. Properties may or may not be listed by the office/agent presenting the information. Some IDX listings have been excluded from this website.
The Digital Millennium Copyright Act of 1998, 17 U.S.C. § 512 (the “DMCA”) provides recourse for copyright owners who believe that material appearing on the Internet infringes their rights under U.S. copyright law. If you believe in good faith that any content or material made available in connection with our website or services infringes your copyright, you (or your agent) may send us a notice requesting that the content or material be removed, or access to it blocked.
Notices must be sent in writing by email to DMCAnotice@MLSGrid.com.
The DMCA requires that your notice of alleged copyright infringement include the following information:
(1) description of the copyrighted work that is the subject of claimed infringement;
(2) description of the alleged infringing content and information sufficient to permit us to locate the content;
(3) contact information for you, including your address, telephone number and email address;
(4) a statement by you that you have a good faith belief that the content in the manner complained of is not authorized by the copyright owner, or its agent, or by the operation of any law;
(5) a statement by you, signed under penalty of perjury, that the information in the notification is accurate and that you have the authority to enforce the copyrights that are claimed to be infringed; and
(6) a physical or electronic signature of the copyright owner or a person authorized to act on the copyright owner’s behalf. Failure to include all of the above information may result in the delay of the processing of your complaint.
- 210 N Grant St
- 29 Roslyn Rd
- 215 W Naperville Rd
- 229 S Park St
- 239 S Park St
- 241 S Park St
- 306 S Grant St
- 124 W Naperville Rd
- 116 W Naperville Rd
- 255 N Grant St
- 331 S Park St
- 260 N Linden Ave
- 226 N Wilmette Ave
- 303 N Cass Ave
- 47 E 55th St
- 131 W Chicago Ave
- 4831 Florence Ave
- 4947 Wilcox Ave
- 403 Burlington Ave
- 308 Sheldon Ave