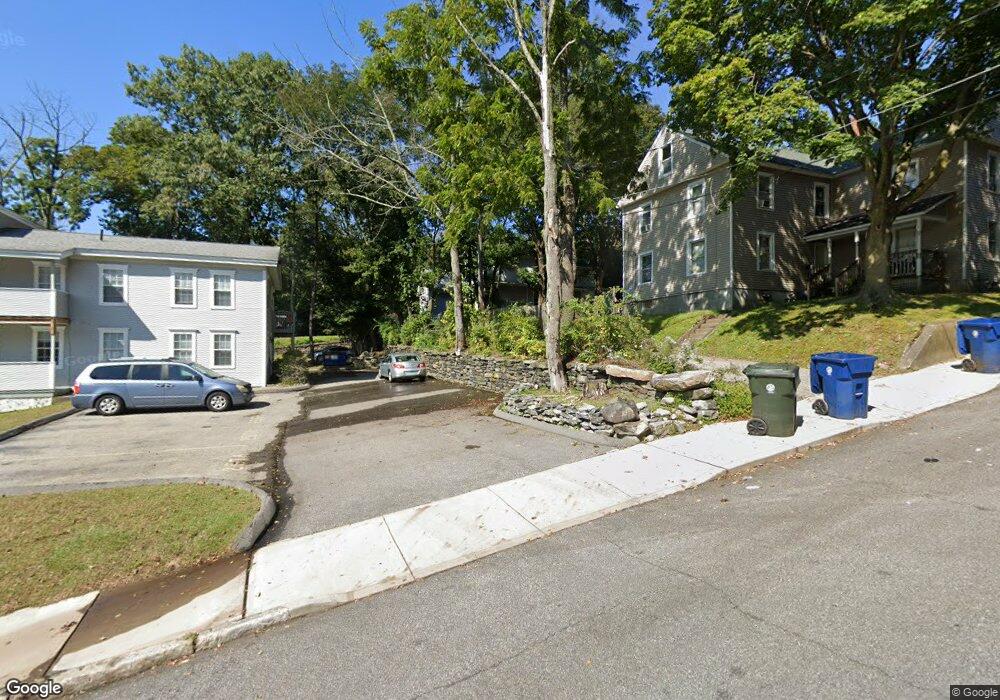
148 Walnut St Willimantic, CT 06226
Estimated Value: $241,113 - $290,000
3
Beds
1
Bath
1,836
Sq Ft
$151/Sq Ft
Est. Value
About This Home
This home is located at 148 Walnut St, Willimantic, CT 06226 and is currently estimated at $276,528, approximately $150 per square foot. 148 Walnut St is a home located in Windham County with nearby schools including Windham Middle School, Windham High School, and St Mary St Joseph School.
Ownership History
Date
Name
Owned For
Owner Type
Purchase Details
Closed on
Jan 29, 2013
Sold by
Deutsche Bank Natl T C
Bought by
Hamilton Nelson E
Current Estimated Value
Purchase Details
Closed on
May 17, 2012
Sold by
Gardiner Robert B
Bought by
Deutsche Bank Natl T C
Purchase Details
Closed on
Sep 30, 2010
Sold by
Pbr Investments Lp
Bought by
Gardiner Robert B
Purchase Details
Closed on
Feb 17, 2005
Sold by
Pbr Investments Lp
Bought by
Gardiner Robert P
Home Financials for this Owner
Home Financials are based on the most recent Mortgage that was taken out on this home.
Original Mortgage
$12,000
Interest Rate
8%
Create a Home Valuation Report for This Property
The Home Valuation Report is an in-depth analysis detailing your home's value as well as a comparison with similar homes in the area
Home Values in the Area
Average Home Value in this Area
Purchase History
| Date | Buyer | Sale Price | Title Company |
|---|---|---|---|
| Hamilton Nelson E | $50,000 | -- | |
| Deutsche Bank Natl T C | -- | -- | |
| Gardiner Robert B | -- | -- | |
| Gardiner Robert P | $134,000 | -- |
Source: Public Records
Mortgage History
| Date | Status | Borrower | Loan Amount |
|---|---|---|---|
| Open | Gardiner Robert P | $103,500 | |
| Previous Owner | Gardiner Robert P | $12,000 | |
| Previous Owner | Gardiner Robert P | $120,600 |
Source: Public Records
Tax History
| Year | Tax Paid | Tax Assessment Tax Assessment Total Assessment is a certain percentage of the fair market value that is determined by local assessors to be the total taxable value of land and additions on the property. | Land | Improvement |
|---|---|---|---|---|
| 2025 | $4,781 | $129,150 | $27,910 | $101,240 |
| 2024 | $4,786 | $129,150 | $27,910 | $101,240 |
| 2023 | $3,487 | $73,560 | $24,270 | $49,290 |
| 2022 | $3,435 | $73,560 | $24,270 | $49,290 |
| 2021 | $3,685 | $73,560 | $24,270 | $49,290 |
| 2020 | $3,677 | $73,560 | $24,270 | $49,290 |
| 2019 | $3,617 | $73,560 | $24,270 | $49,290 |
| 2017 | $3,380 | $71,000 | $21,220 | $49,780 |
| 2015 | $2,439 | $71,000 | $21,220 | $49,780 |
| 2014 | $3,084 | $71,000 | $21,220 | $49,780 |
Source: Public Records
Map
Nearby Homes
- 73 Spring St
- 41 Spring St
- 17 Pearl St
- 129 Valley St
- 26 Maple Ave
- 335 Pleasant St
- 5 Charles St
- 50 South St
- 39 Pleasant View Ave
- 38 Elm St
- 139 South St
- 5 Kathleen Dr
- 119 Quercus Ave
- 615 Jackson St
- 50 Selden St
- 15 Bristol St
- 15 Cracow Ave
- 0 Storrs Rd Unit 2 170571015
- 363 Windham Rd
- 48 Eastbrook Heights Unit C
Your Personal Tour Guide
Ask me questions while you tour the home.