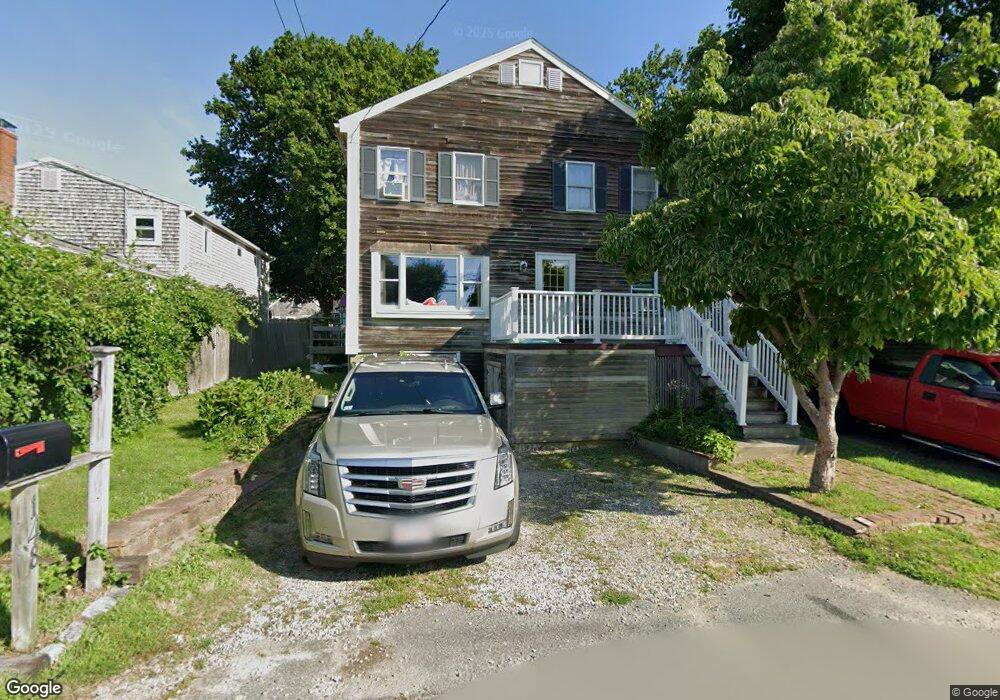
148 Webster Ave Marshfield, MA 02050
Ocean Bluff-Brant Rock NeighborhoodEstimated Value: $595,000 - $757,000
4
Beds
2
Baths
1,660
Sq Ft
$390/Sq Ft
Est. Value
About This Home
This home is located at 148 Webster Ave, Marshfield, MA 02050 and is currently estimated at $647,717, approximately $390 per square foot. 148 Webster Ave is a home located in Plymouth County with nearby schools including Governor Edward Winslow School, Furnace Brook Middle School, and Marshfield High School.
Ownership History
Date
Name
Owned For
Owner Type
Purchase Details
Closed on
Mar 25, 2021
Sold by
Mottola Sandra A
Bought by
Mottola Joseph A and Mottola Katherine E
Current Estimated Value
Home Financials for this Owner
Home Financials are based on the most recent Mortgage that was taken out on this home.
Original Mortgage
$307,500
Outstanding Balance
$275,167
Interest Rate
2.73%
Mortgage Type
Purchase Money Mortgage
Estimated Equity
$372,550
Create a Home Valuation Report for This Property
The Home Valuation Report is an in-depth analysis detailing your home's value as well as a comparison with similar homes in the area
Home Values in the Area
Average Home Value in this Area
Purchase History
| Date | Buyer | Sale Price | Title Company |
|---|---|---|---|
| Mottola Joseph A | $410,000 | None Available |
Source: Public Records
Mortgage History
| Date | Status | Borrower | Loan Amount |
|---|---|---|---|
| Open | Mottola Joseph A | $307,500 | |
| Closed | Mottola Joseph A | $307,500 |
Source: Public Records
Tax History
| Year | Tax Paid | Tax Assessment Tax Assessment Total Assessment is a certain percentage of the fair market value that is determined by local assessors to be the total taxable value of land and additions on the property. | Land | Improvement |
|---|---|---|---|---|
| 2025 | $5,854 | $591,300 | $317,600 | $273,700 |
| 2024 | $5,845 | $562,600 | $297,800 | $264,800 |
| 2023 | $5,478 | $490,100 | $268,000 | $222,100 |
| 2022 | $5,478 | $423,000 | $228,300 | $194,700 |
| 2021 | $5,188 | $393,300 | $218,400 | $174,900 |
| 2020 | $4,780 | $358,600 | $188,600 | $170,000 |
| 2019 | $4,666 | $348,700 | $188,600 | $160,100 |
| 2018 | $4,618 | $345,400 | $188,600 | $156,800 |
| 2017 | $4,422 | $322,300 | $178,700 | $143,600 |
| 2016 | $4,197 | $302,400 | $168,700 | $133,700 |
| 2015 | $3,975 | $299,100 | $168,700 | $130,400 |
| 2014 | $3,887 | $292,500 | $168,700 | $123,800 |
Source: Public Records
Map
Nearby Homes
Your Personal Tour Guide
Ask me questions while you tour the home.