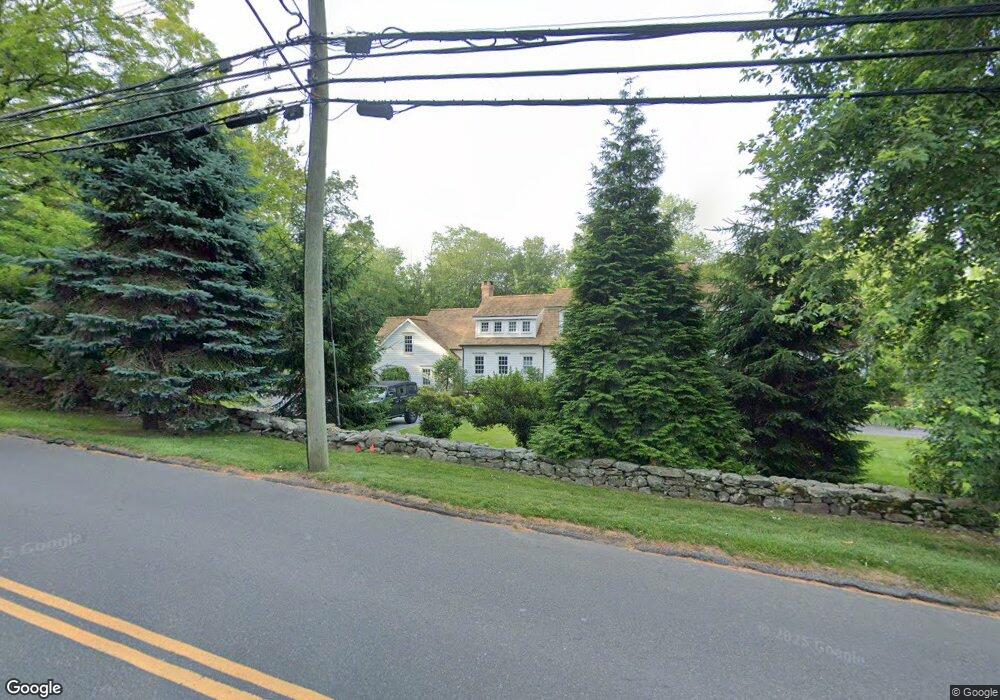
148 West Rd New Canaan, CT 06840
Estimated Value: $2,632,000 - $3,672,401
5
Beds
8
Baths
5,239
Sq Ft
$618/Sq Ft
Est. Value
About This Home
This home is located at 148 West Rd, New Canaan, CT 06840 and is currently estimated at $3,237,850, approximately $618 per square foot. 148 West Rd is a home located in Fairfield County with nearby schools including West Elementary School, Saxe Middle School, and New Canaan High School.
Ownership History
Date
Name
Owned For
Owner Type
Purchase Details
Closed on
Apr 15, 2005
Sold by
Calfo Jason P and Calfo Janet V
Bought by
Koo Paul and Koo Lucy E
Current Estimated Value
Home Financials for this Owner
Home Financials are based on the most recent Mortgage that was taken out on this home.
Original Mortgage
$999,999
Interest Rate
4.75%
Purchase Details
Closed on
May 20, 1994
Sold by
Hedges Robert B and Hedges Christie P
Bought by
Calfo Jason P and Calfo Janet
Home Financials for this Owner
Home Financials are based on the most recent Mortgage that was taken out on this home.
Original Mortgage
$550,000
Interest Rate
7.38%
Mortgage Type
Unknown
Purchase Details
Closed on
Apr 23, 1992
Sold by
Wickett Joan
Bought by
Hedges Robert and Hedges Christine
Create a Home Valuation Report for This Property
The Home Valuation Report is an in-depth analysis detailing your home's value as well as a comparison with similar homes in the area
Home Values in the Area
Average Home Value in this Area
Purchase History
| Date | Buyer | Sale Price | Title Company |
|---|---|---|---|
| Koo Paul | $1,670,000 | -- | |
| Calfo Jason P | $740,000 | -- | |
| Hedges Robert | $635,000 | -- |
Source: Public Records
Mortgage History
| Date | Status | Borrower | Loan Amount |
|---|---|---|---|
| Open | Hedges Robert | $1,005,000 | |
| Closed | Hedges Robert | $999,999 | |
| Previous Owner | Hedges Robert | $595,000 | |
| Previous Owner | Hedges Robert | $550,000 |
Source: Public Records
Tax History Compared to Growth
Tax History
| Year | Tax Paid | Tax Assessment Tax Assessment Total Assessment is a certain percentage of the fair market value that is determined by local assessors to be the total taxable value of land and additions on the property. | Land | Improvement |
|---|---|---|---|---|
| 2025 | $32,687 | $1,958,460 | $819,280 | $1,139,180 |
| 2024 | $31,610 | $1,958,460 | $819,280 | $1,139,180 |
| 2023 | $31,697 | $1,673,560 | $747,040 | $926,520 |
| 2022 | $30,743 | $1,673,560 | $747,040 | $926,520 |
| 2021 | $30,392 | $1,673,560 | $747,040 | $926,520 |
| 2020 | $30,392 | $1,673,560 | $747,040 | $926,520 |
| 2019 | $30,526 | $1,673,560 | $747,040 | $926,520 |
| 2018 | $29,549 | $1,742,300 | $807,030 | $935,270 |
| 2017 | $23,899 | $1,433,670 | $807,030 | $626,640 |
| 2016 | $19,185 | $1,176,280 | $807,030 | $369,250 |
| 2015 | $18,809 | $1,176,280 | $807,030 | $369,250 |
| 2014 | $18,279 | $1,176,280 | $807,030 | $369,250 |
Source: Public Records
Map
Nearby Homes
- 565 Oenoke Ridge
- 204 Parade Hill Rd
- 276 Greenley Rd
- 51 Reeder Ln
- 298 Greenley Rd
- 48 Brookwood Ln
- 101 Parade Hill Rd
- 122 Brookwood Ln
- 148 W Hills Rd
- 61 Smith Ridge Rd
- 52 Garibaldi Ln
- 230 & 244 West Rd
- 145 River St
- 42 Forest St Unit A
- 104 Ramhorne Rd
- 240 Rosebrook Rd
- 104 Dans Hwy
- 561 Smith Ridge Rd
- 15 Burtis Ave Unit Townhome D
- 15 Burtis Ave Unit West Penthouse B