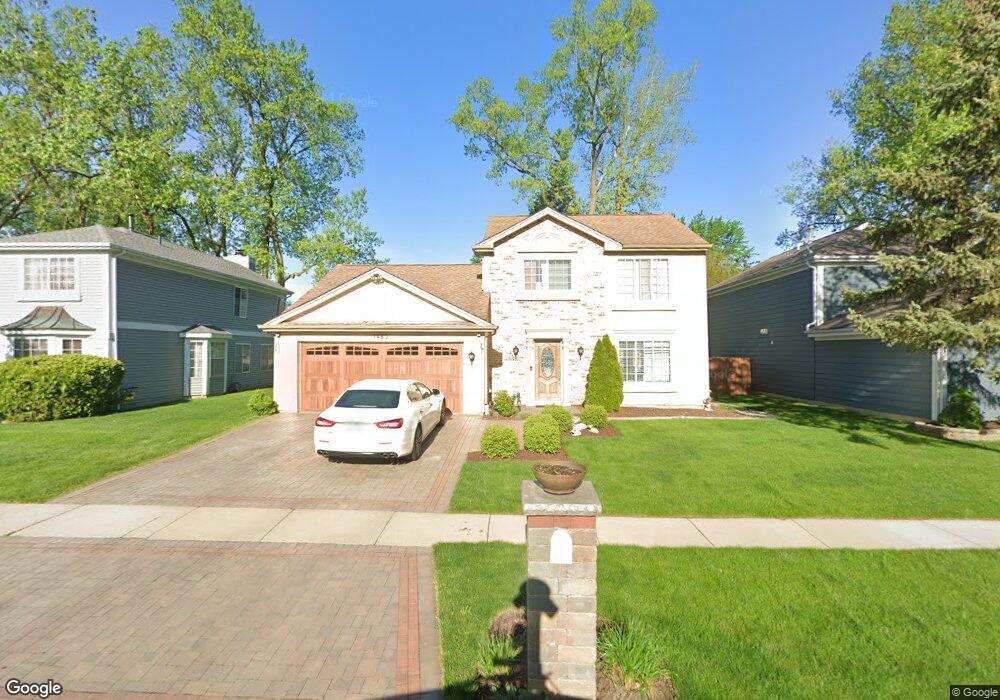
1480 Burr Oak Cir Unit 1 Aurora, IL 60506
Edgelawn Randall NeighborhoodEstimated Value: $305,000 - $353,000
3
Beds
3
Baths
1,508
Sq Ft
$220/Sq Ft
Est. Value
About This Home
This home is located at 1480 Burr Oak Cir Unit 1, Aurora, IL 60506 and is currently estimated at $331,803, approximately $220 per square foot. 1480 Burr Oak Cir Unit 1 is a home located in Kane County with nearby schools including Smith Elementary School, Jewel Middle School, and West Aurora High School.
Ownership History
Date
Name
Owned For
Owner Type
Purchase Details
Closed on
Oct 24, 2002
Sold by
Singh Ravneet and Singh Jasbir K
Bought by
Villalobos Jose P and Valdez Silvia
Current Estimated Value
Home Financials for this Owner
Home Financials are based on the most recent Mortgage that was taken out on this home.
Original Mortgage
$152,840
Outstanding Balance
$63,796
Interest Rate
6.1%
Mortgage Type
FHA
Estimated Equity
$268,007
Purchase Details
Closed on
Oct 19, 1998
Sold by
Dickinson Stephen T
Bought by
Singh Ravneet and Singh Jasbir K
Purchase Details
Closed on
Jul 27, 1994
Sold by
Wilsky Jim J and Wilsky Jane E
Bought by
Dickinson Stephen T
Home Financials for this Owner
Home Financials are based on the most recent Mortgage that was taken out on this home.
Original Mortgage
$116,104
Interest Rate
8.41%
Mortgage Type
FHA
Create a Home Valuation Report for This Property
The Home Valuation Report is an in-depth analysis detailing your home's value as well as a comparison with similar homes in the area
Home Values in the Area
Average Home Value in this Area
Purchase History
| Date | Buyer | Sale Price | Title Company |
|---|---|---|---|
| Villalobos Jose P | $155,000 | Law Title Insurance Co | |
| Singh Ravneet | $129,000 | First American Title Ins Co | |
| Dickinson Stephen T | $79,333 | None Available |
Source: Public Records
Mortgage History
| Date | Status | Borrower | Loan Amount |
|---|---|---|---|
| Open | Villalobos Jose P | $152,840 | |
| Previous Owner | Dickinson Stephen T | $116,104 |
Source: Public Records
Tax History Compared to Growth
Tax History
| Year | Tax Paid | Tax Assessment Tax Assessment Total Assessment is a certain percentage of the fair market value that is determined by local assessors to be the total taxable value of land and additions on the property. | Land | Improvement |
|---|---|---|---|---|
| 2024 | $6,542 | $90,627 | $18,563 | $72,064 |
| 2023 | $6,251 | $80,975 | $16,586 | $64,389 |
| 2022 | $6,009 | $73,882 | $15,133 | $58,749 |
| 2021 | $5,736 | $68,785 | $14,089 | $54,696 |
| 2020 | $5,763 | $67,559 | $13,087 | $54,472 |
| 2019 | $5,534 | $62,595 | $12,125 | $50,470 |
| 2018 | $5,430 | $60,391 | $11,215 | $49,176 |
| 2017 | $5,392 | $58,389 | $10,334 | $48,055 |
| 2016 | $4,915 | $52,269 | $8,858 | $43,411 |
| 2015 | -- | $47,956 | $7,617 | $40,339 |
| 2014 | -- | $44,686 | $7,326 | $37,360 |
| 2013 | -- | $45,466 | $7,221 | $38,245 |
Source: Public Records
Map
Nearby Homes
- 1532 Golden Oaks Pkwy
- 1815 Brighton Cir
- 1035 Newcastle Ln
- 910 Southbridge Dr
- 967 Sapphire Ln
- 959 Sapphire Ln
- 963 Sapphire Ln
- 960 Sapphire Ln
- 964 Sapphire Ln
- 972 Westgate Dr
- 1513 Elder Dr
- 1475 Elder Dr
- 1120 Emerald Dr
- 833 N Randall Rd Unit C4
- 1389 Monomoy St Unit B2
- 1351 Monomoy St Unit D
- 795 N Elmwood Dr
- 781 N Elmwood Dr
- 1104 New Haven Ave
- Lot 16 West Orchard Gateway Blvd
- 1488 Burr Oak Cir Unit 1
- 1472 Burr Oak Cir
- 1496 Burr Oak Cir
- 1464 Burr Oak Cir
- 1475 Burr Oak Cir
- 1483 Burr Oak Cir
- 1504 Burr Oak Cir
- 1467 Burr Oak Cir
- 1456 Burr Oak Cir
- 1491 Burr Oak Cir Unit 1
- 1459 Burr Oak Cir
- 1499 Burr Oak Cir
- 1512 Burr Oak Cir
- 1448 Burr Oak Cir
- 1540 Golden Oaks Pkwy
- 1443 Burr Oak Cir
- 1507 Burr Oak Cir
- 1524 Golden Oaks Pkwy Unit 1
- 1355 N Randall Rd
- 1548 Golden Oaks Pkwy