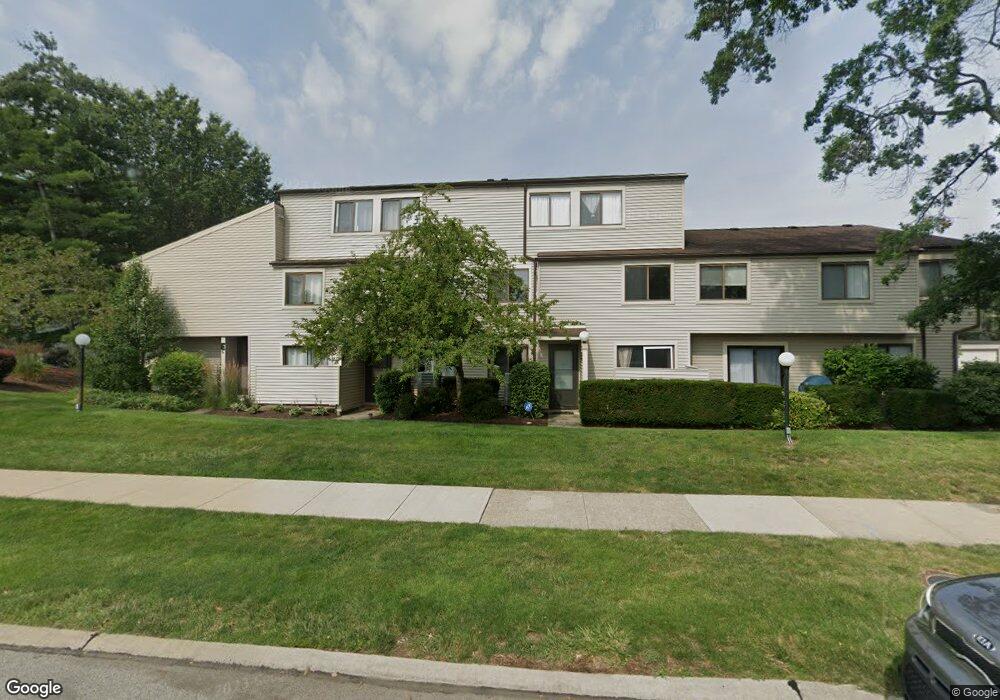
1480 Cedarwood Dr Westlake, OH 44145
Estimated Value: $196,000 - $252,000
3
Beds
2
Baths
1,371
Sq Ft
$164/Sq Ft
Est. Value
About This Home
This home is located at 1480 Cedarwood Dr, Westlake, OH 44145 and is currently estimated at $224,408, approximately $163 per square foot. 1480 Cedarwood Dr is a home located in Cuyahoga County with nearby schools including Dover Intermediate School, Lee Burneson Middle School, and Westlake High School.
Ownership History
Date
Name
Owned For
Owner Type
Purchase Details
Closed on
Aug 23, 2022
Sold by
Schneider Richard L
Bought by
Burhani Crossing Llc
Current Estimated Value
Purchase Details
Closed on
Jul 30, 2004
Sold by
West Robert W and West Elana
Bought by
Schneider Richard L
Home Financials for this Owner
Home Financials are based on the most recent Mortgage that was taken out on this home.
Original Mortgage
$125,000
Interest Rate
6.4%
Mortgage Type
Unknown
Purchase Details
Closed on
Oct 30, 1997
Sold by
Wherry Steven C
Bought by
West Robert W
Home Financials for this Owner
Home Financials are based on the most recent Mortgage that was taken out on this home.
Original Mortgage
$98,200
Interest Rate
7.51%
Mortgage Type
FHA
Purchase Details
Closed on
Sep 1, 1989
Sold by
Dmitruk R C
Bought by
Wherry Steven C
Purchase Details
Closed on
Jun 26, 1984
Sold by
Dmitrak R C
Bought by
Dmitruk R C
Purchase Details
Closed on
Jan 1, 1984
Bought by
Dmitrak R C
Create a Home Valuation Report for This Property
The Home Valuation Report is an in-depth analysis detailing your home's value as well as a comparison with similar homes in the area
Home Values in the Area
Average Home Value in this Area
Purchase History
| Date | Buyer | Sale Price | Title Company |
|---|---|---|---|
| Burhani Crossing Llc | $165,000 | Erieview Title Agency | |
| Schneider Richard L | $125,000 | Chicago Title Insurance C | |
| West Robert W | $104,500 | -- | |
| Wherry Steven C | $77,000 | -- | |
| Dmitruk R C | -- | -- | |
| Dmitrak R C | -- | -- |
Source: Public Records
Mortgage History
| Date | Status | Borrower | Loan Amount |
|---|---|---|---|
| Previous Owner | Schneider Richard L | $125,000 | |
| Previous Owner | West Robert W | $98,200 |
Source: Public Records
Tax History Compared to Growth
Tax History
| Year | Tax Paid | Tax Assessment Tax Assessment Total Assessment is a certain percentage of the fair market value that is determined by local assessors to be the total taxable value of land and additions on the property. | Land | Improvement |
|---|---|---|---|---|
| 2024 | $2,800 | $57,750 | $6,545 | $51,205 |
| 2023 | $2,958 | $51,950 | $5,220 | $46,730 |
| 2022 | $2,899 | $51,940 | $5,220 | $46,730 |
| 2021 | $2,928 | $51,940 | $5,220 | $46,730 |
| 2020 | $2,729 | $44,380 | $4,450 | $39,940 |
| 2019 | $2,625 | $126,800 | $12,700 | $114,100 |
| 2018 | $2,717 | $44,380 | $4,450 | $39,940 |
| 2017 | $2,758 | $43,680 | $3,850 | $39,830 |
| 2016 | $2,744 | $43,680 | $3,850 | $39,830 |
| 2015 | $2,910 | $43,680 | $3,850 | $39,830 |
| 2014 | $2,910 | $45,050 | $3,960 | $41,090 |
Source: Public Records
Map
Nearby Homes
- 1480 Cedarwood Dr Unit 21F
- 1510 Alder Ln Unit 7C
- 1316 Cedarwood Dr Unit D3
- 1625 Cedarwood Dr Unit 218
- 1360 Cedarwood Dr Unit C2
- 1670 Cedarwood Dr Unit 148
- 31000 Logan Ct
- 1476 Bobby Ln Unit 7
- 2066 Bradley Rd
- 29379 Detroit Rd
- 29363 Detroit Rd Unit 5
- 0 Avon Rd Unit 4372753
- 0 Avon Rd Unit 4372752
- 2075 Bassett Rd
- 28323 Farrs Garden Path
- 31035 Wilderness Trail
- 625 Bassett Rd
- 584 Wildbrook Dr
- 31857 Avon Rd
- 624 Millard Dr
- 1480 Cedarwood Dr Unit 21H
- 1480 Cedarwood Dr Unit TWN21E
- 1480 Cedarwood Dr Unit 21C
- 1480 Cedarwood Dr
- 1480 Cedarwood Dr Unit 21B
- 1480 Cedarwood Dr Unit 21D
- 1480 Cedarwood Dr Unit C
- 1480 Cedarwood Dr Unit A
- 1570 Allen Dr
- 1570 Allen Dr
- 1570 Allen Dr
- 1520 Allen Dr
- 1520 Allen Dr
- 1460 Cedarwood Dr Unit 23F
- 1460 Cedarwood Dr Unit 23D
- 1460 Cedarwood Dr Unit 23H
- 1460 Cedarwood Dr
- 1460 Cedarwood Dr Unit 23E
- 1460 Cedarwood Dr
- 1460 Cedarwood Dr