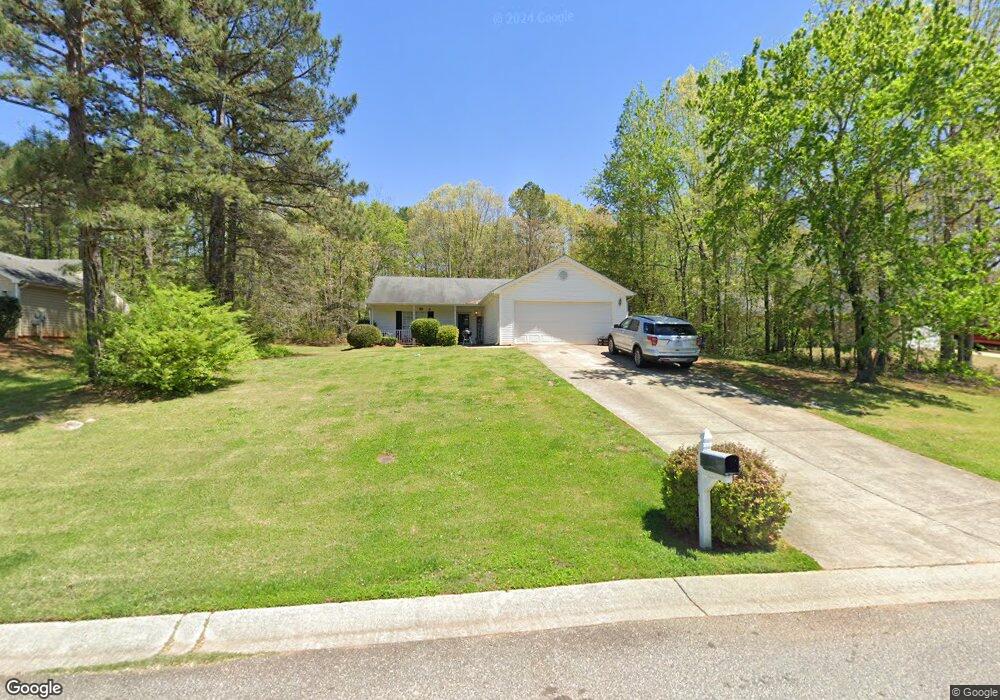
1480 Sedgefield Trail Unit 2 Bethlehem, GA 30620
Estimated Value: $286,000 - $318,000
3
Beds
2
Baths
1,317
Sq Ft
$229/Sq Ft
Est. Value
About This Home
This home is located at 1480 Sedgefield Trail Unit 2, Bethlehem, GA 30620 and is currently estimated at $301,632, approximately $229 per square foot. 1480 Sedgefield Trail Unit 2 is a home located in Barrow County with nearby schools including Bethlehem Elementary School, Haymon-Morris Middle School, and Apalachee High School.
Ownership History
Date
Name
Owned For
Owner Type
Purchase Details
Closed on
Jun 12, 2013
Sold by
Southfork Homes Llc
Bought by
Res Ga Montreaux Llc
Current Estimated Value
Purchase Details
Closed on
Sep 10, 2012
Sold by
Manning Kimberly A
Bought by
Southfork Homes Llc
Purchase Details
Closed on
May 13, 2010
Sold by
Manning Kimberly A
Bought by
Manning Yancy A S and Manning Kimberly A
Purchase Details
Closed on
Mar 2, 2010
Sold by
Saxon Mtg Svcs Inc
Bought by
Federal Home Loan Mortgage Corporation
Purchase Details
Closed on
May 13, 2002
Sold by
Southfork Homes Inc
Bought by
Thomas Bruce
Purchase Details
Closed on
Feb 22, 2002
Sold by
Developme Dun La Hur
Bought by
Southfork Homes Inc
Purchase Details
Closed on
May 2, 2000
Bought by
Developme Dun La Hur
Create a Home Valuation Report for This Property
The Home Valuation Report is an in-depth analysis detailing your home's value as well as a comparison with similar homes in the area
Home Values in the Area
Average Home Value in this Area
Purchase History
| Date | Buyer | Sale Price | Title Company |
|---|---|---|---|
| Res Ga Montreaux Llc | $200,000 | -- | |
| Southfork Homes Llc | $50,000 | -- | |
| Manning Yancy A S | -- | -- | |
| Manning Kimberly A | -- | -- | |
| Federal Home Loan Mortgage Corporation | -- | -- | |
| Saxon Mtg Svcs Inc | $71,946 | -- | |
| Thomas Bruce | $102,900 | -- | |
| Southfork Homes Inc | $380,000 | -- | |
| Developme Dun La Hur | -- | -- |
Source: Public Records
Tax History Compared to Growth
Tax History
| Year | Tax Paid | Tax Assessment Tax Assessment Total Assessment is a certain percentage of the fair market value that is determined by local assessors to be the total taxable value of land and additions on the property. | Land | Improvement |
|---|---|---|---|---|
| 2024 | $2,439 | $95,665 | $23,200 | $72,465 |
| 2023 | $2,433 | $95,665 | $23,200 | $72,465 |
| 2022 | $2,098 | $70,541 | $16,000 | $54,541 |
| 2021 | $1,940 | $61,310 | $16,000 | $45,310 |
| 2020 | $1,755 | $55,017 | $14,000 | $41,017 |
| 2019 | $1,785 | $55,017 | $14,000 | $41,017 |
| 2018 | $1,764 | $55,017 | $14,000 | $41,017 |
| 2017 | $1,178 | $40,447 | $10,000 | $30,447 |
| 2016 | $1,225 | $37,715 | $10,000 | $27,715 |
| 2015 | $1,240 | $38,026 | $10,000 | $28,026 |
| 2014 | $1,173 | $34,608 | $6,272 | $28,336 |
| 2013 | -- | $33,230 | $6,272 | $26,958 |
Source: Public Records
Map
Nearby Homes
- 3153 Lowell Rd
- 468 Grand Oaks Ave
- 0 Tanners Bridge Cir Unit 10536031
- 1101 Ravenwood Dr
- 480 Raider Way
- 1071 Covenant Ct
- 222 Lynn Rd
- 3800 George Williams Rd
- 763 Moss Side Dr
- 1217 Cabin Bridge Rd
- 103 Camp Ct
- 384 Winslow Ct
- 0 Jb Owens Unit 7552902
- 0 Jb Owens Unit 7552891
- 0 Jb Owens Unit LOT 2 - 2.09 ACRES
- 0 Jb Owens Unit LOT 3 - 2.01 ACRES
- 637 Sleeping Meadow Ln
- 1035 Lucienne Blvd
- 1047 Lucienne Blvd
- 308 Meadows Dr
- 1480 Sedgefield Trail
- 1490 Sedgefield Trail
- 1470 Sedgefield Trail Unit 1
- 1470 Sedgefield Trail
- 1460 Sedgefield Trail
- 1500 Sedgefield Trail Unit 2
- 1500 Sedgefield Trail
- 1500 Sedgefield Trail Unit 1
- 1485 Sedgefield Trail
- 1485 Sedgefield Trail Unit 2
- 1485 Sedgefield Trail
- 1475 Sedgefield Trail Unit 1
- 1475 Sedgefield Trail
- 1375 Morrow Dr Unit 1
- 1450 Sedgefield Trail Unit 1
- 1395 Morrow Dr
- 1365 Morrow Dr
- 1510 Sedgefield Trail
- 1455 Sedgefield Trail
- 511 Grand Oaks Ave