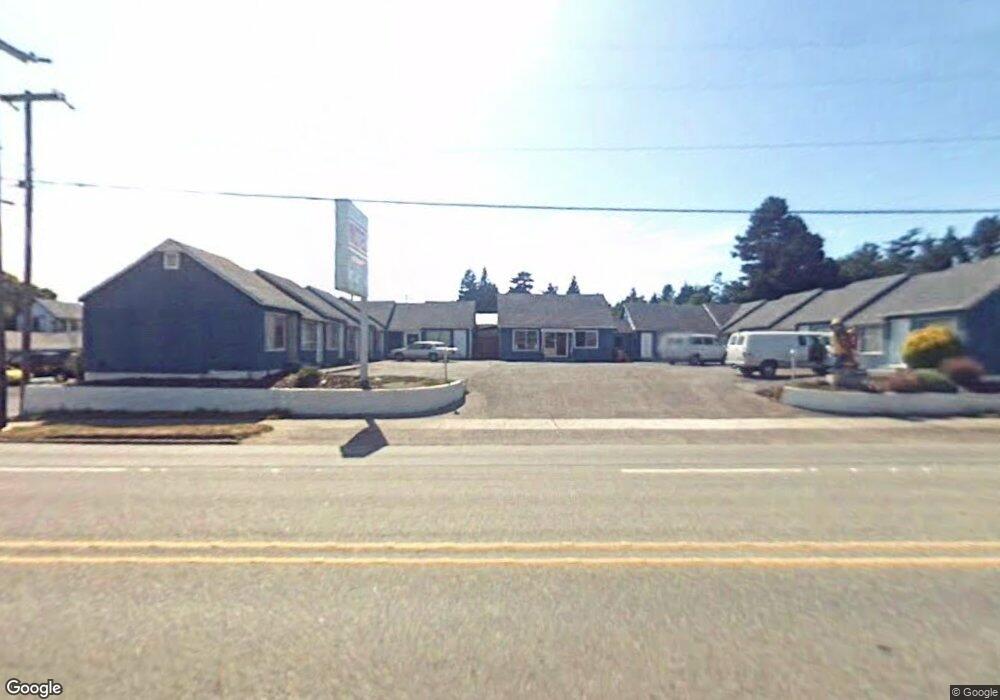
1480 Sherman Ave North Bend, OR 97459
Estimated Value: $806,645
--
Bed
--
Bath
1
Sq Ft
$806,645/Sq Ft
Est. Value
About This Home
This home is located at 1480 Sherman Ave, North Bend, OR 97459 and is currently estimated at $806,645, approximately $806,645 per square foot. 1480 Sherman Ave is a home located in Coos County with nearby schools including Hillcrest Elementary School, North Bay Elementary School, and North Bend Middle School.
Ownership History
Date
Name
Owned For
Owner Type
Purchase Details
Closed on
May 14, 2021
Sold by
1480Ps Llc
Bought by
Hope Operation Rebuild
Current Estimated Value
Purchase Details
Closed on
Mar 10, 2016
Sold by
Ogaard Erik
Bought by
1480Ps Llc
Home Financials for this Owner
Home Financials are based on the most recent Mortgage that was taken out on this home.
Original Mortgage
$447,900
Interest Rate
3.65%
Mortgage Type
Commercial
Purchase Details
Closed on
Nov 24, 2006
Sold by
Scott Laverne L and Olander Laverne L
Bought by
Ogaard Erik
Purchase Details
Closed on
Jan 20, 2004
Sold by
Kashmere Barbara
Bought by
Ogaard Erik
Home Financials for this Owner
Home Financials are based on the most recent Mortgage that was taken out on this home.
Original Mortgage
$260,000
Interest Rate
5.86%
Mortgage Type
Seller Take Back
Create a Home Valuation Report for This Property
The Home Valuation Report is an in-depth analysis detailing your home's value as well as a comparison with similar homes in the area
Home Values in the Area
Average Home Value in this Area
Purchase History
| Date | Buyer | Sale Price | Title Company |
|---|---|---|---|
| Hope Operation Rebuild | $650,000 | Ticor Title Company Of Or | |
| 1480Ps Llc | $550,000 | Ticor Title Company | |
| Ogaard Erik | -- | Fidelity National Title Co | |
| Ogaard Erik | $360,000 | Fidelity National Title Co |
Source: Public Records
Mortgage History
| Date | Status | Borrower | Loan Amount |
|---|---|---|---|
| Previous Owner | 1480Ps Llc | $447,900 | |
| Previous Owner | Ogaard Erik | $260,000 |
Source: Public Records
Tax History Compared to Growth
Tax History
| Year | Tax Paid | Tax Assessment Tax Assessment Total Assessment is a certain percentage of the fair market value that is determined by local assessors to be the total taxable value of land and additions on the property. | Land | Improvement |
|---|---|---|---|---|
| 2024 | $7,598 | $493,760 | -- | -- |
| 2023 | $7,374 | $479,380 | $0 | $0 |
| 2022 | $7,295 | $465,420 | $0 | $0 |
| 2021 | $7,473 | $451,870 | $0 | $0 |
| 2020 | $7,000 | $451,870 | $0 | $0 |
| 2019 | $6,695 | $425,940 | $0 | $0 |
| 2018 | $6,350 | $405,050 | $0 | $0 |
| 2017 | $6,349 | $405,050 | $0 | $0 |
| 2016 | $6,034 | $385,760 | $0 | $0 |
| 2015 | $6,241 | $413,540 | $0 | $0 |
| 2014 | $6,241 | $401,500 | $0 | $0 |
Source: Public Records
Map
Nearby Homes
- 1508 Union Ave
- 1524 Sheridan Ave
- 1405 Union Ave
- 1556 Mcpherson Ave
- 1662 Mcpherson Ave
- 1678 Meade St
- 1346 Bayview St
- 0 Monroe St
- 1371 Bayview St
- 1368 Bayview St
- 437 Simpson Ave
- 1845 Monroe St
- 1921 Monroe St
- 1902 Monroe St
- 2021 Meade St
- 70298 Highway 101
- 0 N Us Hwy 101 Unit 22554067
- 2115 Hamilton St
- 2109 Harrison St
- 2185 Jackson St
- 1477 Union Ave
- 1489 Union Ave
- 1504 Sherman Ave Unit 1
- 1504 Sherman Ave
- 1446 Sherman Ave
- 1457 Union Ave
- 1515 Union Ave
- 1439 Union Ave
- 1520 Sherman Ave
- 1438 Sherman Ave
- 1480 Union Ave
- 1509 Sherman Ave
- 1494 Union Ave
- 1487 Sherman Ave
- 1493 Sherman Ave
- 1541 Union Ave
- 1481 Sherman Ave
- 1425 Union Ave
- 1468 Union Ave
- 1475 Sherman Ave