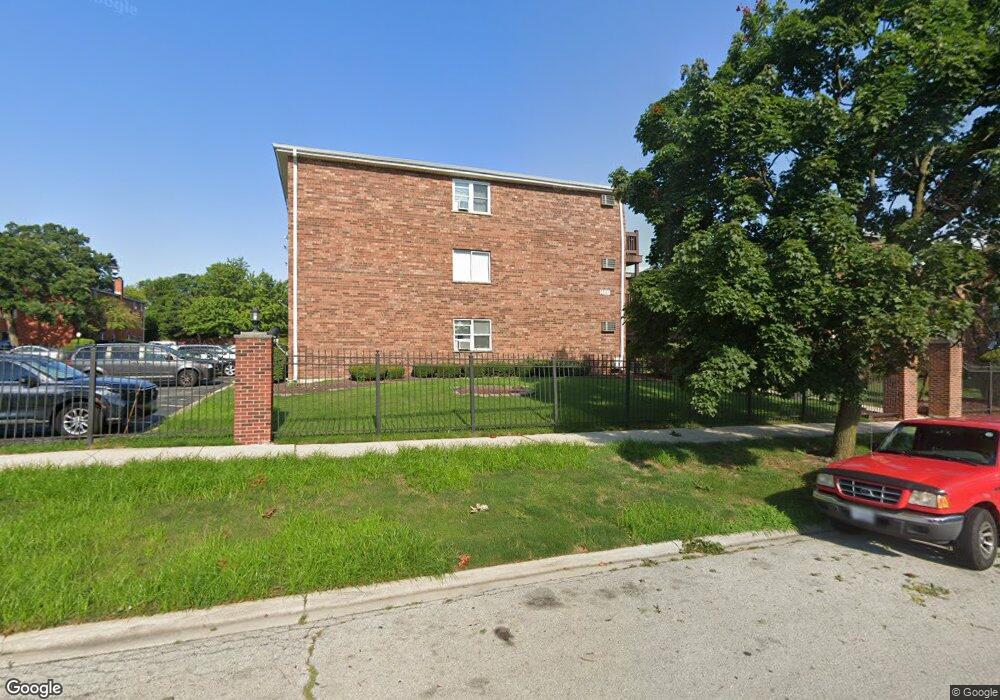
14800 Ketelaar Dr Unit 1003 Midlothian, IL 60445
Estimated Value: $75,000 - $93,000
1
Bed
1
Bath
700
Sq Ft
$125/Sq Ft
Est. Value
About This Home
This home is located at 14800 Ketelaar Dr Unit 1003, Midlothian, IL 60445 and is currently estimated at $87,318, approximately $124 per square foot. 14800 Ketelaar Dr Unit 1003 is a home located in Cook County with nearby schools including Lee R Foster Elementary School, Jack Hille Middle School, and Oak Forest High School.
Ownership History
Date
Name
Owned For
Owner Type
Purchase Details
Closed on
Aug 14, 2018
Sold by
Unity Community Revitalization Corp
Bought by
Bopp Barbara
Current Estimated Value
Purchase Details
Closed on
Jun 25, 2018
Sold by
Fannie Mae
Bought by
Unity Community Revitalization Corp
Purchase Details
Closed on
Mar 21, 2018
Sold by
Peculis Johanne M and Peculis Johanne Michelie
Bought by
Federal National Mortgage Association
Purchase Details
Closed on
Aug 6, 2003
Sold by
Hedman Laura M
Bought by
Peculis Johanne M
Home Financials for this Owner
Home Financials are based on the most recent Mortgage that was taken out on this home.
Original Mortgage
$60,680
Interest Rate
5.69%
Mortgage Type
Purchase Money Mortgage
Purchase Details
Closed on
Jun 5, 1998
Sold by
Palos Bank & Trust Company
Bought by
Hedman Laura M
Create a Home Valuation Report for This Property
The Home Valuation Report is an in-depth analysis detailing your home's value as well as a comparison with similar homes in the area
Home Values in the Area
Average Home Value in this Area
Purchase History
| Date | Buyer | Sale Price | Title Company |
|---|---|---|---|
| Bopp Barbara | $30,000 | First American Title | |
| Unity Community Revitalization Corp | $30,000 | First American Title | |
| Federal National Mortgage Association | $36,293 | None Available | |
| Peculis Johanne M | $62,000 | First American Title | |
| Hedman Laura M | -- | -- |
Source: Public Records
Mortgage History
| Date | Status | Borrower | Loan Amount |
|---|---|---|---|
| Previous Owner | Peculis Johanne M | $60,680 |
Source: Public Records
Tax History Compared to Growth
Tax History
| Year | Tax Paid | Tax Assessment Tax Assessment Total Assessment is a certain percentage of the fair market value that is determined by local assessors to be the total taxable value of land and additions on the property. | Land | Improvement |
|---|---|---|---|---|
| 2024 | $2,335 | $6,512 | $428 | $6,084 |
| 2023 | $1,815 | $6,512 | $428 | $6,084 |
| 2022 | $1,815 | $3,915 | $428 | $3,487 |
| 2021 | $1,764 | $3,913 | $427 | $3,486 |
| 2020 | $1,690 | $3,913 | $427 | $3,486 |
| 2019 | $2,177 | $5,001 | $397 | $4,604 |
| 2018 | $1,353 | $6,606 | $397 | $6,209 |
| 2017 | $1,336 | $6,606 | $397 | $6,209 |
| 2016 | $987 | $4,801 | $335 | $4,466 |
| 2015 | $912 | $4,801 | $335 | $4,466 |
| 2014 | $162 | $4,801 | $335 | $4,466 |
| 2013 | $1,506 | $6,796 | $335 | $6,461 |
Source: Public Records
Map
Nearby Homes
- 14840 Kilpatrick Ave Unit 604
- 14845 Cicero Ave
- 14710 Kenton Ave
- 14704 Kenton Ave
- 14815 Kenton Ave Unit 1
- 14631 Knox Ave
- 14647 Lamon Ave
- 4653 146th St
- 14602 Kenton Ave
- 14624 Kolmar Ave
- 14612 Kolmar Ave
- 14819 Anne Ct
- 14832 Kenneth Ave
- 14951 Kilbourne Ave
- 14913 Sheila Ct
- 15115 Cicero Ave
- 14455 Lamon Ave Unit 1S
- 14632 Kostner Ave
- 15117 La Crosse Ave
- 14544 Kostner Ave
- 14800 Ketelaar Dr Unit 6E
- 14800 Ketelaar Dr Unit 1002
- 14800 Ketelaar Dr Unit 1008
- 14800 Ketelaar Dr Unit 1009
- 14800 Ketelaar Dr Unit 1012
- 14800 Ketelaar Dr Unit 1005
- 14800 Ketelaar Dr Unit 1004
- 14800 Ketelaar Dr Unit 1011
- 14800 Ketelaar Dr Unit 1001
- 14800 Ketelaar Dr Unit 2E
- 14800 Ketelaar Dr Unit 1007
- 14800 Ketelaar Dr Unit 1006
- 14800 Ketelaar Dr Unit 1010
- 14800 Ketelaar Dr Unit 1E
- 14800 Ketelaar Dr Unit 5E
- 14800 Ketelaar Dr Unit 4W
- 14800 Ketelaar Dr Unit 3E
- 14810 Ketelaar Dr Unit 908
- 14810 Ketelaar Dr Unit 901
- 14810 Ketelaar Dr Unit 904