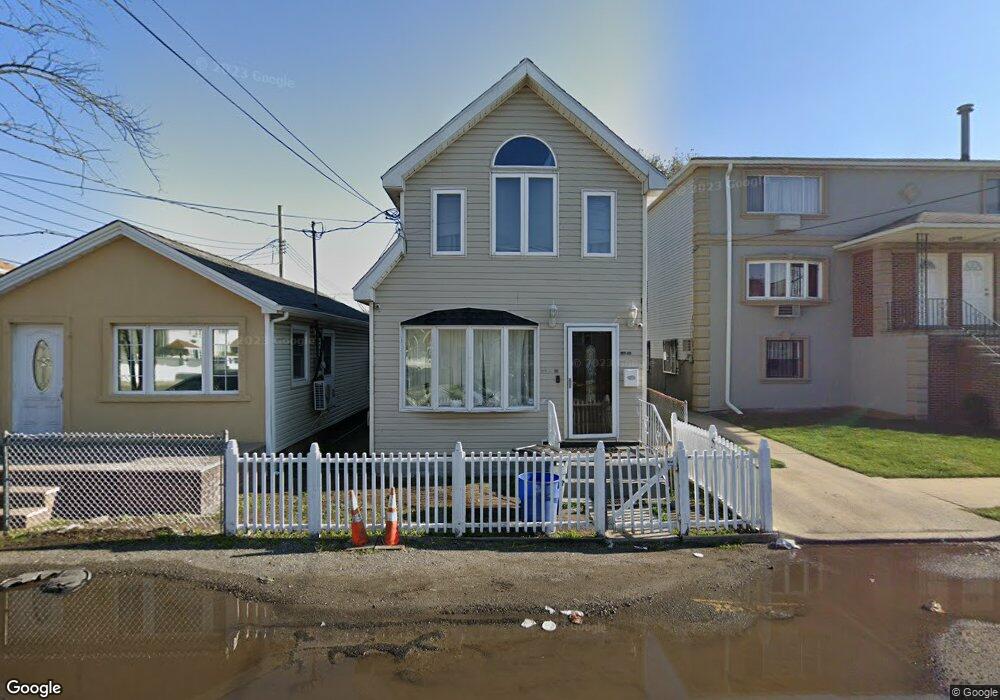
14803 236th St Rosedale, NY 11422
Rosedale NeighborhoodEstimated Value: $584,928 - $697,000
--
Bed
--
Bath
1,300
Sq Ft
$499/Sq Ft
Est. Value
About This Home
This home is located at 14803 236th St, Rosedale, NY 11422 and is currently estimated at $648,982, approximately $499 per square foot. 14803 236th St is a home located in Queens County with nearby schools including P.S. 181 Brookfield, Collaborative Arts Middle School, and Success Academy Charter School - Rosedale.
Ownership History
Date
Name
Owned For
Owner Type
Purchase Details
Closed on
Nov 22, 2017
Sold by
Rosedale Holdings 2017 Llc
Bought by
Simms Mavis and Wynter Charles
Current Estimated Value
Home Financials for this Owner
Home Financials are based on the most recent Mortgage that was taken out on this home.
Original Mortgage
$412,392
Outstanding Balance
$345,566
Interest Rate
3.94%
Mortgage Type
New Conventional
Estimated Equity
$303,416
Purchase Details
Closed on
Feb 1, 2017
Sold by
Almestica Mary and Almestica Del Castillo
Bought by
Rosedale Holdings 2017 Llc
Purchase Details
Closed on
Jan 29, 2015
Sold by
Almestica Mary and Delcastillo Paul Del
Bought by
236 Jarabacoa Realty Inc
Purchase Details
Closed on
Nov 22, 2005
Sold by
Tribaldos Bertulfo
Bought by
Almestica Mary and Almestica Del Castillo
Home Financials for this Owner
Home Financials are based on the most recent Mortgage that was taken out on this home.
Original Mortgage
$47,250
Interest Rate
6.17%
Create a Home Valuation Report for This Property
The Home Valuation Report is an in-depth analysis detailing your home's value as well as a comparison with similar homes in the area
Home Values in the Area
Average Home Value in this Area
Purchase History
| Date | Buyer | Sale Price | Title Company |
|---|---|---|---|
| Simms Mavis | $420,000 | -- | |
| Rosedale Holdings 2017 Llc | $250,000 | -- | |
| Almestica Mary | -- | -- | |
| 236 Jarabacoa Realty Inc | -- | -- | |
| Almestica Mary | $315,000 | -- | |
| Almestica Mary | $315,000 | -- |
Source: Public Records
Mortgage History
| Date | Status | Borrower | Loan Amount |
|---|---|---|---|
| Open | Simms Mavis | $412,392 | |
| Previous Owner | Almestica Mary | $47,250 | |
| Previous Owner | Almestica Mary | $252,000 |
Source: Public Records
Tax History Compared to Growth
Tax History
| Year | Tax Paid | Tax Assessment Tax Assessment Total Assessment is a certain percentage of the fair market value that is determined by local assessors to be the total taxable value of land and additions on the property. | Land | Improvement |
|---|---|---|---|---|
| 2025 | $2,526 | $13,010 | $1,535 | $11,475 |
| 2024 | $2,526 | $12,578 | $1,711 | $10,867 |
| 2023 | $2,383 | $11,867 | $1,456 | $10,411 |
| 2022 | $2,249 | $34,440 | $4,440 | $30,000 |
| 2021 | $2,371 | $29,400 | $4,440 | $24,960 |
| 2020 | $2,295 | $28,800 | $4,440 | $24,360 |
| 2019 | $2,193 | $28,920 | $4,440 | $24,480 |
| 2018 | $2,016 | $9,889 | $1,931 | $7,958 |
| 2017 | $1,914 | $9,390 | $2,518 | $6,872 |
| 2016 | $1,877 | $9,390 | $2,518 | $6,872 |
| 2015 | $1,020 | $9,035 | $4,258 | $4,777 |
| 2014 | $1,020 | $9,316 | $4,399 | $4,917 |
Source: Public Records
Map
Nearby Homes
- 238-11 148th Dr
- 23514 147th Dr
- 238-47 148th Dr
- 23915 147th Rd
- 26 240th St
- 241-12 148th Ave
- 24112 148th Ave
- 147-11 232nd St
- 240-24 149th Ave
- 241-23 148th Ave
- 147-50 231st St
- 14848 231st St
- 23027 148th Ave
- 241-49 148th Dr
- 147-37 230th St
- 14632 Huxley St
- 24519 147th Dr
- 241-08 Newhall Ave
- 146-15 243rd St
- 24533 147th Rd
- 148-27 236th St
- 14801 236th St
- 148-03 236th St
- 148-03 236th St
- 14839 236th St
- 23612 Bentley Rd
- 23612 Bentley Rd
- 23605 Bentley Rd
- 23605 Bentley Rd Unit 2nd Fl
- 23607 Bentley Rd
- 23614 Bentley Rd
- 236-14 Bentley Rd
- 23611 Bentley Rd
- 23605 Bentley Rd
- 148-41 236th St
- 14841 236th St
- 148-30 236th St
- 148-39 236th St
- 14844 Brookville Blvd
- 23601A Bentley Rd