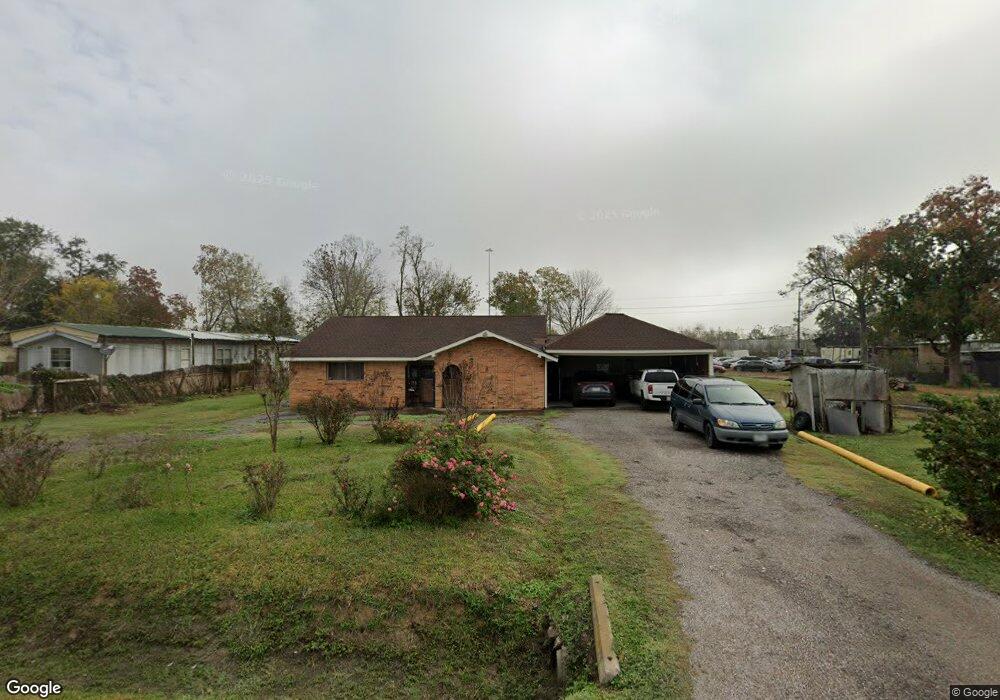
14808 Sweeney Rd Houston, TX 77060
Estimated Value: $228,000 - $255,000
3
Beds
2
Baths
1,938
Sq Ft
$126/Sq Ft
Est. Value
About This Home
This home is located at 14808 Sweeney Rd, Houston, TX 77060 and is currently estimated at $244,490, approximately $126 per square foot. 14808 Sweeney Rd is a home located in Harris County with nearby schools including Hinojosa EC/PK/K, Odom Elementary School, and Aldine Middle School.
Ownership History
Date
Name
Owned For
Owner Type
Purchase Details
Closed on
Dec 29, 1997
Sold by
Banc One Mtg Corp
Bought by
Ferrill Trent Allen and Ferrill Jeannine Marie
Current Estimated Value
Home Financials for this Owner
Home Financials are based on the most recent Mortgage that was taken out on this home.
Original Mortgage
$38,752
Outstanding Balance
$6,725
Interest Rate
7.14%
Mortgage Type
FHA
Estimated Equity
$237,765
Purchase Details
Closed on
Dec 23, 1994
Sold by
Rodriguez Eduardo and Rodriguez Juanita
Bought by
Rubio Mercedes and Rubio Jesus
Home Financials for this Owner
Home Financials are based on the most recent Mortgage that was taken out on this home.
Original Mortgage
$30,551
Interest Rate
9.13%
Mortgage Type
Seller Take Back
Purchase Details
Closed on
Nov 2, 1993
Sold by
Valdez R Jose Javier
Bought by
Rodriguez Eduardo
Create a Home Valuation Report for This Property
The Home Valuation Report is an in-depth analysis detailing your home's value as well as a comparison with similar homes in the area
Home Values in the Area
Average Home Value in this Area
Purchase History
| Date | Buyer | Sale Price | Title Company |
|---|---|---|---|
| Ferrill Trent Allen | -- | American Title | |
| Rubio Mercedes | -- | Fidelity National Title | |
| Rodriguez Eduardo | -- | -- |
Source: Public Records
Mortgage History
| Date | Status | Borrower | Loan Amount |
|---|---|---|---|
| Open | Ferrill Trent Allen | $38,752 | |
| Previous Owner | Rubio Mercedes | $30,551 | |
| Closed | Rubio Mercedes | $20,144 |
Source: Public Records
Tax History Compared to Growth
Tax History
| Year | Tax Paid | Tax Assessment Tax Assessment Total Assessment is a certain percentage of the fair market value that is determined by local assessors to be the total taxable value of land and additions on the property. | Land | Improvement |
|---|---|---|---|---|
| 2025 | $274 | $211,260 | $56,000 | $155,260 |
| 2024 | $274 | $256,634 | $56,000 | $200,634 |
| 2023 | $274 | $256,634 | $56,000 | $200,634 |
| 2022 | $3,188 | $160,586 | $33,950 | $126,636 |
| 2021 | $3,048 | $155,313 | $33,950 | $121,363 |
| 2020 | $2,923 | $149,709 | $28,000 | $121,709 |
| 2019 | $2,783 | $0 | $0 | $0 |
| 2018 | $475 | $116,996 | $28,000 | $88,996 |
| 2017 | $2,581 | $116,996 | $28,000 | $88,996 |
| 2016 | $2,347 | $103,546 | $21,000 | $82,546 |
| 2015 | $703 | $97,169 | $21,000 | $76,169 |
| 2014 | $703 | $86,678 | $21,000 | $65,678 |
Source: Public Records
Map
Nearby Homes
- 14811 W Hardy Rd
- 1114 Blackwood Ave
- 14929 Henry Rd
- 1159 Aldine Meadows Rd
- 15035 Lillja Rd
- 347 Saddle Horn Dr
- 15607 Dowlwood Dr
- 810 Benmar Dr
- 15114 Kaler Rd
- 15123 Kaler Rd
- 0 Verhalen
- 15806 Sulky Trail Ct
- 15150 Dogwood Tree St
- 13920 Reeveston Rd
- 251 Goodson Dr
- 307 Sulky Trail St
- 611 Glenvale Dr
- 715 Branding Iron Ln
- 1042 Tunell Ln
- 522 Hollyvale Dr
- 14810 Sweeney Rd
- 14720 Sweeney Rd
- 14807 Sweeney Rd
- 14715 Sweeney Rd
- 14715 Sweeney Rd
- 14716 Sweeney Rd
- 14812 Sweeney Rd
- 14813 Sweeney Rd
- 14725 W Hardy Rd
- 14710 Sweeney Rd
- 14817 Sweeney Rd
- 15718 Henry Rd
- 15718 Henry Rd
- 14709 W Hardy Rd
- 14706 Sweeney Rd
- 15808 Henry Rd
- 661 Buffington St
- 14810 Regnal St
- 14818 Regnal St
- 660 Buffington St