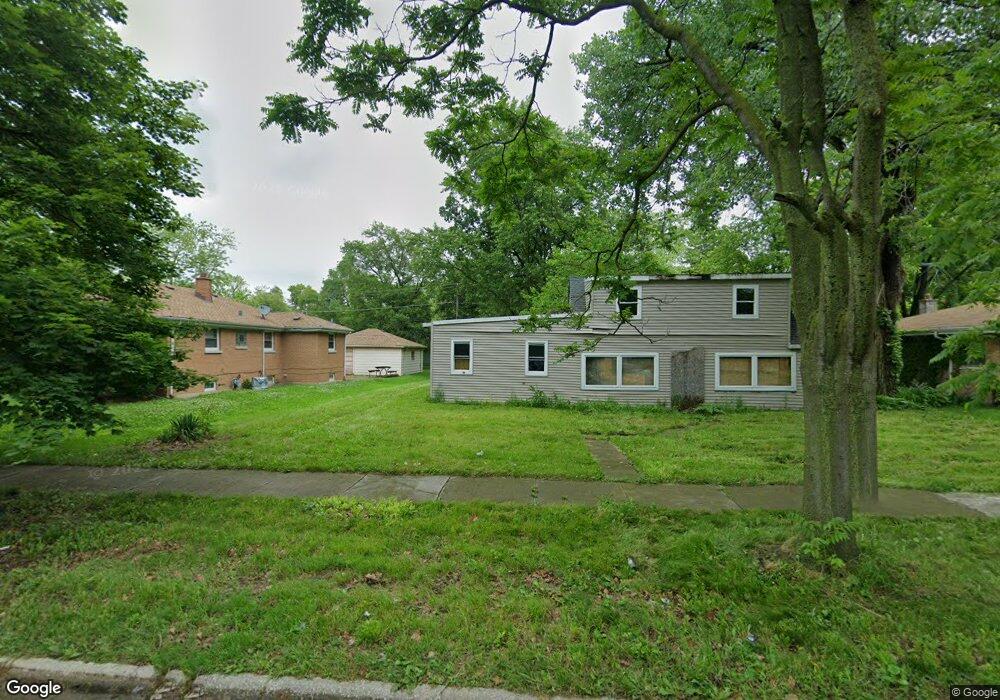
14809 Clark St Dolton, IL 60419
Estimated Value: $139,198 - $214,000
3
Beds
1
Bath
1,675
Sq Ft
$96/Sq Ft
Est. Value
About This Home
This home is located at 14809 Clark St, Dolton, IL 60419 and is currently estimated at $161,550, approximately $96 per square foot. 14809 Clark St is a home located in Cook County with nearby schools including Roosevelt Elementary School, Roosevelt Junior High School, and Thornton Township High School.
Ownership History
Date
Name
Owned For
Owner Type
Purchase Details
Closed on
Jul 10, 2009
Sold by
Bank Of New York
Bought by
Williams Theresa
Current Estimated Value
Purchase Details
Closed on
Nov 28, 2007
Sold by
Washington
Bought by
Bank Of New York
Purchase Details
Closed on
Jul 27, 2006
Sold by
Iceland Inc
Bought by
Washington Marshaun
Home Financials for this Owner
Home Financials are based on the most recent Mortgage that was taken out on this home.
Original Mortgage
$105,000
Interest Rate
8.87%
Mortgage Type
New Conventional
Purchase Details
Closed on
Jun 9, 2006
Sold by
Kaszula Anna S
Bought by
Iceland Inc
Home Financials for this Owner
Home Financials are based on the most recent Mortgage that was taken out on this home.
Original Mortgage
$105,000
Interest Rate
8.87%
Mortgage Type
New Conventional
Create a Home Valuation Report for This Property
The Home Valuation Report is an in-depth analysis detailing your home's value as well as a comparison with similar homes in the area
Home Values in the Area
Average Home Value in this Area
Purchase History
| Date | Buyer | Sale Price | Title Company |
|---|---|---|---|
| Williams Theresa | $5,000 | Forum Title Insurance Co | |
| Bank Of New York | -- | Forum Title Insurance Compan | |
| Washington Marshaun | $140,000 | Pntn | |
| Iceland Inc | $50,000 | None Available |
Source: Public Records
Mortgage History
| Date | Status | Borrower | Loan Amount |
|---|---|---|---|
| Previous Owner | Washington Marshaun | $105,000 |
Source: Public Records
Tax History
| Year | Tax Paid | Tax Assessment Tax Assessment Total Assessment is a certain percentage of the fair market value that is determined by local assessors to be the total taxable value of land and additions on the property. | Land | Improvement |
|---|---|---|---|---|
| 2025 | $5,590 | $8,500 | $4,239 | $4,261 |
| 2024 | $5,590 | $8,500 | $4,239 | $4,261 |
| 2023 | $5,125 | $8,500 | $4,239 | $4,261 |
| 2022 | $5,125 | $6,043 | $3,741 | $2,302 |
| 2021 | $5,064 | $6,042 | $3,740 | $2,302 |
| 2020 | $3,145 | $3,970 | $3,740 | $230 |
| 2019 | $3,321 | $3,789 | $3,491 | $298 |
| 2018 | $3,221 | $3,789 | $3,491 | $298 |
| 2017 | $3,032 | $3,789 | $3,491 | $298 |
| 2016 | $2,613 | $3,564 | $3,241 | $323 |
| 2015 | $2,533 | $3,564 | $3,241 | $323 |
| 2014 | $2,513 | $3,564 | $3,241 | $323 |
| 2013 | $2,370 | $3,655 | $3,241 | $414 |
Source: Public Records
Map
Nearby Homes
- 14844 Dearborn St
- 14733 La Salle St
- 14916 La Salle St
- 14918 Wabash Ave
- 14724 Michigan Ave
- 14920 Wentworth Ave
- 14717 E Riverside Dr
- 14824 Edbrooke Ave
- 14633 Wabash Ave
- 14622 Wabash Ave
- 14914 Edbrooke Ave
- 14633 Parkside Dr
- 14632 Edbrooke Ave
- 14727 Riverside Dr
- 14817 S Wentworth Ave
- 14637 Edbrooke Ave
- 14924 Indiana Ave
- 14525 S State St
- 14600 Princeton Ave
- 119 E 146th St
- 47 W 148th St
- 14815 Clark St
- 14811 Clark St
- 14808 Dearborn St
- 14802 Dearborn St
- 14821 Clark St
- 14814 Dearborn St
- 14820 Dearborn St
- 14808 Clark St
- 14743 Clark St
- 14814 Clark St
- 14802 Clark St
- 14827 Clark St
- 14742 Dearborn St
- 14820 Clark St
- 14828 Dearborn St
- 14741 Clark St
- 14742 Clark St
- 14833 Clark St
- 14826 Clark St
Your Personal Tour Guide
Ask me questions while you tour the home.