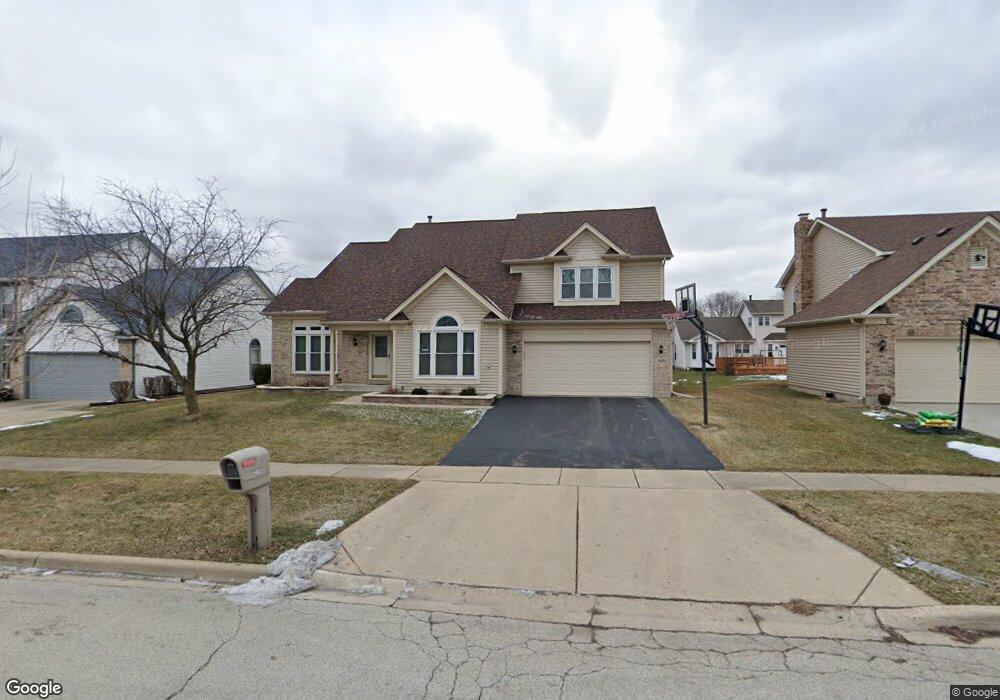
1481 Crowfoot Cir N Hoffman Estates, IL 60169
South Hoffman Estates NeighborhoodEstimated Value: $711,129 - $755,000
4
Beds
3
Baths
3,400
Sq Ft
$217/Sq Ft
Est. Value
About This Home
This home is located at 1481 Crowfoot Cir N, Hoffman Estates, IL 60169 and is currently estimated at $737,782, approximately $216 per square foot. 1481 Crowfoot Cir N is a home located in Cook County with nearby schools including Hoover Math And Science Academy, Helen Keller Junior High School, and Hoffman Estates High School.
Ownership History
Date
Name
Owned For
Owner Type
Purchase Details
Closed on
Apr 6, 2022
Sold by
Patel Mahul R and Patel Sweta
Bought by
Patel Sweta M and Sweta M Patel Living Trust
Current Estimated Value
Purchase Details
Closed on
Aug 4, 2021
Sold by
Patel Mahul R and Patel Sweta
Bought by
Sweta M Patel Living Trust and Sweta M Patel Living Trust
Purchase Details
Closed on
Dec 9, 2008
Sold by
Sienkiewicz Jacek and Sienkiewicz Cathryn
Bought by
Patel Mahul R and Patel Sweta
Home Financials for this Owner
Home Financials are based on the most recent Mortgage that was taken out on this home.
Original Mortgage
$265,000
Interest Rate
5.03%
Mortgage Type
Purchase Money Mortgage
Purchase Details
Closed on
Jul 23, 1997
Sold by
Bedrosian Charles and Bedrosian Charles
Bought by
Sienkiewicz Jacek and Sienkiewicz Cathryn
Home Financials for this Owner
Home Financials are based on the most recent Mortgage that was taken out on this home.
Original Mortgage
$232,800
Interest Rate
9.1%
Create a Home Valuation Report for This Property
The Home Valuation Report is an in-depth analysis detailing your home's value as well as a comparison with similar homes in the area
Home Values in the Area
Average Home Value in this Area
Purchase History
| Date | Buyer | Sale Price | Title Company |
|---|---|---|---|
| Patel Sweta M | -- | -- | |
| Sweta M Patel Living Trust | -- | None Listed On Document | |
| Patel Mahul R | $440,000 | Security Title | |
| Sienkiewicz Jacek | $291,000 | -- |
Source: Public Records
Mortgage History
| Date | Status | Borrower | Loan Amount |
|---|---|---|---|
| Previous Owner | Patel Mahul R | $265,000 | |
| Previous Owner | Sienkiewicz Jacek | $232,800 |
Source: Public Records
Tax History Compared to Growth
Tax History
| Year | Tax Paid | Tax Assessment Tax Assessment Total Assessment is a certain percentage of the fair market value that is determined by local assessors to be the total taxable value of land and additions on the property. | Land | Improvement |
|---|---|---|---|---|
| 2024 | $15,247 | $53,001 | $12,128 | $40,873 |
| 2023 | $14,724 | $53,001 | $12,128 | $40,873 |
| 2022 | $14,724 | $53,001 | $12,128 | $40,873 |
| 2021 | $13,207 | $42,750 | $10,712 | $32,038 |
| 2020 | $12,973 | $42,750 | $10,712 | $32,038 |
| 2019 | $12,902 | $47,500 | $10,712 | $36,788 |
| 2018 | $14,182 | $46,929 | $9,095 | $37,834 |
| 2017 | $13,949 | $46,929 | $9,095 | $37,834 |
| 2016 | $13,237 | $46,929 | $9,095 | $37,834 |
| 2015 | $12,326 | $41,000 | $7,882 | $33,118 |
| 2014 | $12,125 | $41,000 | $7,882 | $33,118 |
| 2013 | $13,069 | $45,139 | $7,882 | $37,257 |
Source: Public Records
Map
Nearby Homes
- 1475 Crowfoot Cir S
- 775 Harmon Blvd
- 1103 Southbridge Ln
- 1121 Southbridge Ln
- 700 N Hundley St
- 1352 W Oakmont Rd
- 640 Downey St
- 1365 Blair Ln
- 1912 Finchley Ct Unit 3
- 1105 Wilmington Ln
- 808 Bishop Ct Unit 2
- 1415 N Oakmont Rd
- 1020 Denham Place Unit 1
- 604 N Brookdale Dr
- 1074 Wilmington Ln
- 1901 Kingsley Dr
- 1375 Rebecca Dr Unit 318
- 1360 Devonshire Ln
- 1475 Rebecca Dr Unit 217
- 1425 Colwyn Dr
- 1471 Crowfoot Cir N
- 1491 Crowfoot Cir N
- 1480 Crowfoot Cir S
- 1470 Crowfoot Cir S
- 1490 Crowfoot Cir S
- 1501 Crowfoot Cir N
- 1461 Crowfoot Cir N
- 1500 Crowfoot Cir S
- 1460 Crowfoot Cir S
- 1511 Crowfoot Cir N
- 1510 Crowfoot Cir S
- 1485 Crowfoot Cir S
- 1465 Crowfoot Cir S
- 1495 Crowfoot Cir S
- 1521 Crowfoot Cir N
- 1405 Crowfoot Cir S
- 1455 Crowfoot Cir S
- 1520 Crowfoot Cir S
- 1505 Crowfoot Cir S
- 1445 Crowfoot Cir N