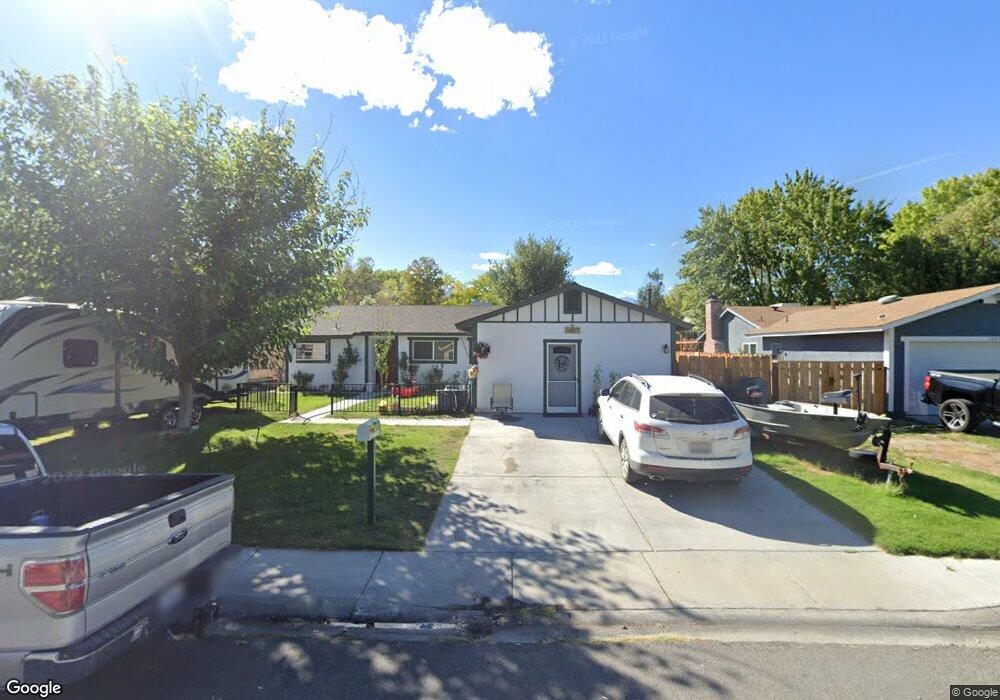
1481 Lazy A Dr Bishop, CA 93514
Estimated Value: $537,799 - $639,000
4
Beds
3
Baths
1,278
Sq Ft
$462/Sq Ft
Est. Value
About This Home
This home is located at 1481 Lazy A Dr, Bishop, CA 93514 and is currently estimated at $590,200, approximately $461 per square foot. 1481 Lazy A Dr is a home located in Inyo County with nearby schools including Bishop Elementary School, Home Street Middle School, and Bishop Union High School.
Create a Home Valuation Report for This Property
The Home Valuation Report is an in-depth analysis detailing your home's value as well as a comparison with similar homes in the area
Home Values in the Area
Average Home Value in this Area
Tax History
| Year | Tax Paid | Tax Assessment Tax Assessment Total Assessment is a certain percentage of the fair market value that is determined by local assessors to be the total taxable value of land and additions on the property. | Land | Improvement |
|---|---|---|---|---|
| 2025 | $2,460 | $240,483 | $83,969 | $156,514 |
| 2024 | $2,460 | $235,769 | $82,323 | $153,446 |
| 2023 | $2,403 | $231,147 | $80,709 | $150,438 |
| 2022 | $2,353 | $226,616 | $79,127 | $147,489 |
| 2021 | $2,353 | $222,174 | $77,576 | $144,598 |
| 2020 | $2,274 | $219,897 | $76,781 | $143,116 |
| 2019 | $2,274 | $215,586 | $75,276 | $140,310 |
| 2018 | $2,223 | $211,359 | $73,800 | $137,559 |
| 2017 | $2,177 | $207,215 | $72,353 | $134,862 |
| 2016 | $2,151 | $203,153 | $70,935 | $132,218 |
| 2015 | $2,109 | $200,102 | $69,870 | $130,232 |
| 2014 | $2,066 | $196,183 | $68,502 | $127,681 |
Source: Public Records
Map
Nearby Homes
- 2391 Galloway Ave
- 2308 Loch Lomond Ave
- 2322 Galloway Ave
- 2307 Galloway Ave
- 2428 Choctaw Dr
- 1631 Shoshone Dr
- 1443 Shelly Creek Rd
- 2268 Mcgalliard Ave
- 2280 Baskerville Ave
- 2229 Fiora Ave
- 2297 Brigadoon Ave
- 2205 Edinburgh Ave
- 2222 Brigadoon Ave
- 2323 Grazide Cir
- 370 Ranch Rd
- 725 W Elm St
- 0 US Highway 6
- 771 N Main St Unit 124
- 771 N Main St Unit 53
- 324 Mclaren Ln
- 1487 Lazy A Dr Unit 118
- 1487 Lazy A Dr
- 1475 Lazy A Dr
- 1493 Lazy A Dr Unit 6
- 1493 Lazy A Dr
- 1469 Lazy A Dr
- 1476 Bear Creek Dr
- 1470 Bear Creek Dr Unit 30
- 1470 Bear Creek Dr
- 1482 Bear Creek Dr
- 1464 Bear Creek Dr
- 1503 Lazy A Dr Unit 1
- 1503 Lazy A Dr
- 1463 Lazy A Dr
- 1474 Lazy A Dr
- 1480 Lazy A Dr
- 1468 Lazy A Dr
- 1488 Bear Creek Dr
- 1458 Bear Creek Dr
- 1486 Lazy A Dr
Your Personal Tour Guide
Ask me questions while you tour the home.