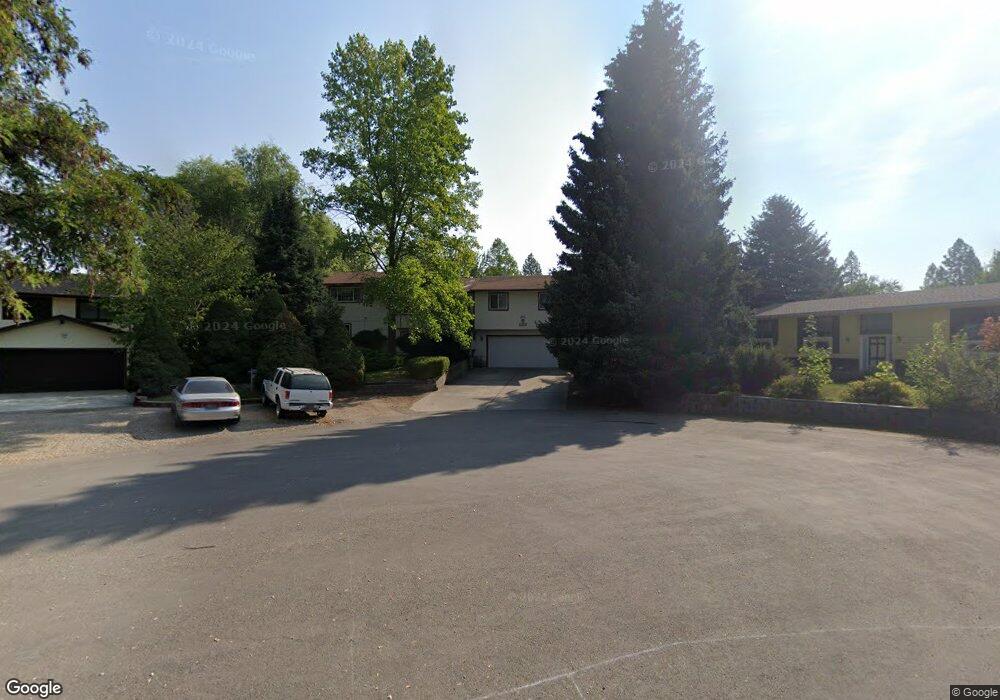
1481 N Majesty Ct Post Falls, ID 83854
The Highlands NeighborhoodEstimated Value: $608,672 - $813,000
5
Beds
3
Baths
3,388
Sq Ft
$203/Sq Ft
Est. Value
About This Home
This home is located at 1481 N Majesty Ct, Post Falls, ID 83854 and is currently estimated at $686,918, approximately $202 per square foot. 1481 N Majesty Ct is a home located in Kootenai County with nearby schools including Ponderosa Elementary School, Post Falls Middle School, and Post Falls High School.
Ownership History
Date
Name
Owned For
Owner Type
Purchase Details
Closed on
Mar 23, 2017
Sold by
Remington Timothy D and Remington Cynthia M
Bought by
Remington Timothy D and Remington Cynthia M
Current Estimated Value
Purchase Details
Closed on
May 17, 2011
Sold by
Fannie Mae
Bought by
Remington Timothy D and Remington Cynthia M
Purchase Details
Closed on
Aug 3, 2010
Sold by
Jones Lawrence Raisin and Jones Gail Annette
Bought by
Federal National Mortgage Association
Purchase Details
Closed on
Aug 10, 2006
Sold by
Seher Steven E and Seher Joanne
Bought by
Jones Lawrence Raisin and Jones Gail Annette
Home Financials for this Owner
Home Financials are based on the most recent Mortgage that was taken out on this home.
Original Mortgage
$160,500
Interest Rate
6.76%
Mortgage Type
Balloon
Create a Home Valuation Report for This Property
The Home Valuation Report is an in-depth analysis detailing your home's value as well as a comparison with similar homes in the area
Home Values in the Area
Average Home Value in this Area
Purchase History
| Date | Buyer | Sale Price | Title Company |
|---|---|---|---|
| Remington Timothy D | -- | None Available | |
| Remington Timothy D | -- | -- | |
| Federal National Mortgage Association | $254,350 | -- | |
| Jones Lawrence Raisin | -- | -- |
Source: Public Records
Mortgage History
| Date | Status | Borrower | Loan Amount |
|---|---|---|---|
| Previous Owner | Jones Lawrence Raisin | $160,500 |
Source: Public Records
Tax History Compared to Growth
Tax History
| Year | Tax Paid | Tax Assessment Tax Assessment Total Assessment is a certain percentage of the fair market value that is determined by local assessors to be the total taxable value of land and additions on the property. | Land | Improvement |
|---|---|---|---|---|
| 2025 | $2,096 | $572,145 | $163,625 | $408,520 |
| 2024 | $2,096 | $544,980 | $130,900 | $414,080 |
| 2023 | $2,096 | $534,953 | $154,000 | $380,953 |
| 2022 | $2,531 | $630,191 | $154,000 | $476,191 |
| 2021 | $2,741 | $415,970 | $110,000 | $305,970 |
| 2020 | $2,339 | $314,910 | $105,000 | $209,910 |
| 2019 | $2,386 | $287,740 | $90,000 | $197,740 |
| 2018 | $2,337 | $259,960 | $80,000 | $179,960 |
| 2017 | $2,436 | $248,670 | $70,000 | $178,670 |
| 2016 | $2,407 | $233,830 | $62,000 | $171,830 |
| 2015 | $2,505 | $234,510 | $62,000 | $172,510 |
| 2013 | $2,268 | $194,150 | $35,000 | $159,150 |
Source: Public Records
Map
Nearby Homes
- 747 N Dundee Dr
- 750 N Dundee Dr
- 690 N McDonald Ct
- 4550 E Savea Ln
- 4570 E Savea Ln
- 4618 E Savea Ln
- 4450 E Savea Ln
- 4519 E Savea Ln
- Xavier Plan at Ashlar Ranch
- Winfield Plan at Ashlar Ranch
- Westbrook Plan at Ashlar Ranch
- Vanbrough Plan at Ashlar Ranch
- Townsend Plan at Ashlar Ranch
- Stanton Plan at Ashlar Ranch
- Somerley Plan at Ashlar Ranch
- Scottsford Plan at Ashlar Ranch
- Ravenstone Plan at Ashlar Ranch
- Pembroke Plan at Ashlar Ranch
- Knighton Plan at Ashlar Ranch
- Northfield Plan at Ashlar Ranch
- 1473 N Majesty Ct
- 1494 N Majesty Ct
- 1447 N Majesty Ct
- 880 Kings (Str Sign Majesty Ct) Ct
- 1548 N Havichur Loop
- 1562 N Havichur Loop
- 1498 N Havichur Loop
- 1480 N Majesty Ct
- 1420 N Majesty Ct
- 719 N Muirfield Ct
- 5016 E Royal Dr
- 1466 N Havichur Loop
- 860 N Majesty Ct
- 830 N Majesty Ct
- 4995 E Royal Dr
- 4951 E Royal Dr
- 717 N Muirfield Ct
- 5070 E Royal Dr
- 5080 E Royal Dr
- 1580 N Havichur Loop