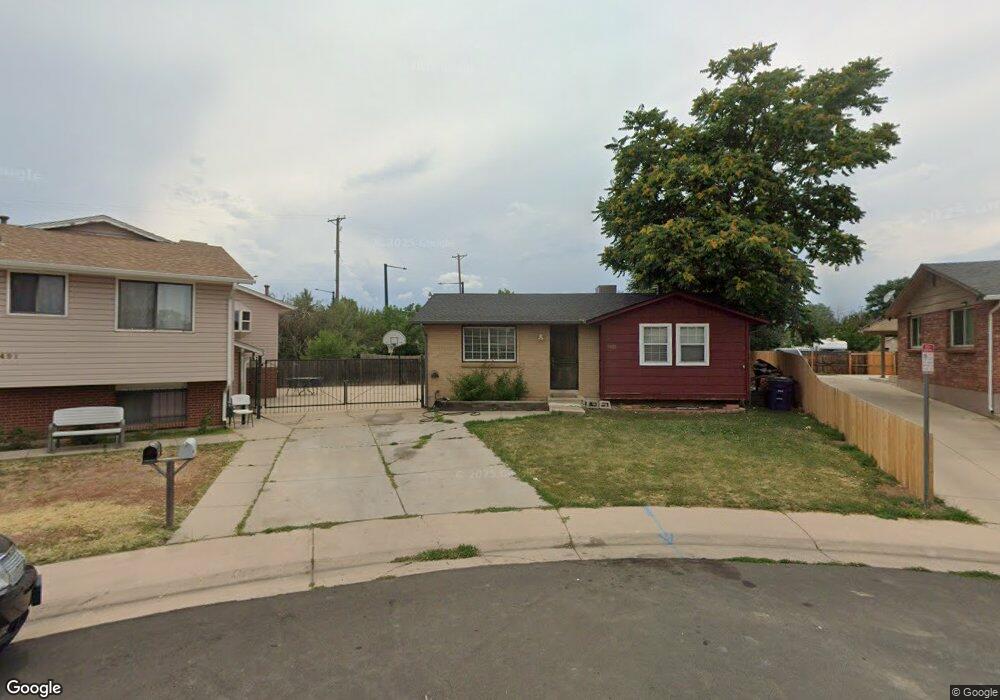
1481 S King Ct Denver, CO 80219
Mar Lee NeighborhoodEstimated Value: $364,711 - $436,000
2
Beds
1
Bath
906
Sq Ft
$440/Sq Ft
Est. Value
About This Home
This home is located at 1481 S King Ct, Denver, CO 80219 and is currently estimated at $398,928, approximately $440 per square foot. 1481 S King Ct is a home located in Denver County with nearby schools including Charles M. Schenck Community School, Kepner Beacon Middle School, and West High School.
Ownership History
Date
Name
Owned For
Owner Type
Purchase Details
Closed on
Sep 30, 2024
Sold by
Dass Joel E I and Dass Azra J
Bought by
Dass Joel E I and Dass Azra J
Current Estimated Value
Purchase Details
Closed on
May 23, 2019
Sold by
Dass Joel E I and Dass Azra J
Bought by
Dass Joel E I and Dass Azra J
Purchase Details
Closed on
May 7, 2019
Sold by
Dass Joel E I and Dass Azra J
Bought by
Dass Joel E L and Dass Azra J
Purchase Details
Closed on
Apr 28, 2011
Sold by
Dass Azra J
Bought by
Dass Joel E I and Dass Azra J
Home Financials for this Owner
Home Financials are based on the most recent Mortgage that was taken out on this home.
Original Mortgage
$138,349
Interest Rate
4.82%
Mortgage Type
New Conventional
Purchase Details
Closed on
Oct 23, 2007
Sold by
Dass Azra J
Bought by
Dass Joel Ej and Dass Azra J
Purchase Details
Closed on
Oct 29, 2003
Sold by
Dass Joel E I and Dass Azra J
Bought by
Dass Azra J
Create a Home Valuation Report for This Property
The Home Valuation Report is an in-depth analysis detailing your home's value as well as a comparison with similar homes in the area
Home Values in the Area
Average Home Value in this Area
Purchase History
| Date | Buyer | Sale Price | Title Company |
|---|---|---|---|
| Dass Joel E I | -- | None Listed On Document | |
| Dass Joel E I | -- | None Available | |
| Dass Joel E L | -- | None Available | |
| Dass Joel E I | -- | Fidelity National Title Insu | |
| Dass Joel Ej | -- | None Available | |
| Dass Azra J | -- | -- |
Source: Public Records
Mortgage History
| Date | Status | Borrower | Loan Amount |
|---|---|---|---|
| Previous Owner | Dass Joel E I | $138,349 |
Source: Public Records
Tax History Compared to Growth
Tax History
| Year | Tax Paid | Tax Assessment Tax Assessment Total Assessment is a certain percentage of the fair market value that is determined by local assessors to be the total taxable value of land and additions on the property. | Land | Improvement |
|---|---|---|---|---|
| 2024 | $2,181 | $27,540 | $2,450 | $25,090 |
| 2023 | $2,134 | $27,540 | $2,450 | $25,090 |
| 2022 | $1,909 | $24,000 | $6,370 | $17,630 |
| 2021 | $1,909 | $24,680 | $6,550 | $18,130 |
| 2020 | $1,470 | $19,810 | $6,550 | $13,260 |
| 2019 | $1,429 | $19,810 | $6,550 | $13,260 |
| 2018 | $1,238 | $16,000 | $5,230 | $10,770 |
| 2017 | $1,234 | $16,000 | $5,230 | $10,770 |
| 2016 | $1,034 | $12,680 | $5,166 | $7,514 |
| 2015 | $991 | $12,680 | $5,166 | $7,514 |
| 2014 | $841 | $10,130 | $3,041 | $7,089 |
Source: Public Records
Map
Nearby Homes
- 1516 S Lowell Blvd
- 995 S Lowell Blvd
- 1431 S Meade St
- 1589 S Michigan Way
- 3300 W Florida Ave Unit 35
- 3300 W Florida Ave Unit 36
- 364 S Newton St
- 419 S Osceola St
- 415 S Osceola St
- 405 S Osceola St
- 3333 W Arkansas Ave
- 990 S Meade St
- 1562 S Osceola Way
- 1358 S Irving St Unit 9
- 1358 S Irving St Unit 53
- 1561 S Patton Ct
- 1624 S Patton Ct
- 3245 W Mexico Ave
- 1381 S Perry St
- 1470 S Quitman St
- 1471 S King Ct
- 1491 S King Ct
- 1465 S King Ct
- 1490 S King Ct
- 1461 S King Ct
- 1485 S Lowell Blvd
- 1500 S Lowell Blvd
- 1480 S King Ct
- 1470 S King Ct
- 1499 S Lowell Blvd
- 1464 S King Ct
- 1501 S King St
- 1460 S King Ct
- 1465 S Lowell Blvd
- 1451 S King Ct
- 1508 S Lowell Blvd
- 1475 S Lowell Blvd
- 1501 S Lowell Blvd
- 1501 S Lowell Blvd Unit L
- 1455 S Lowell Blvd