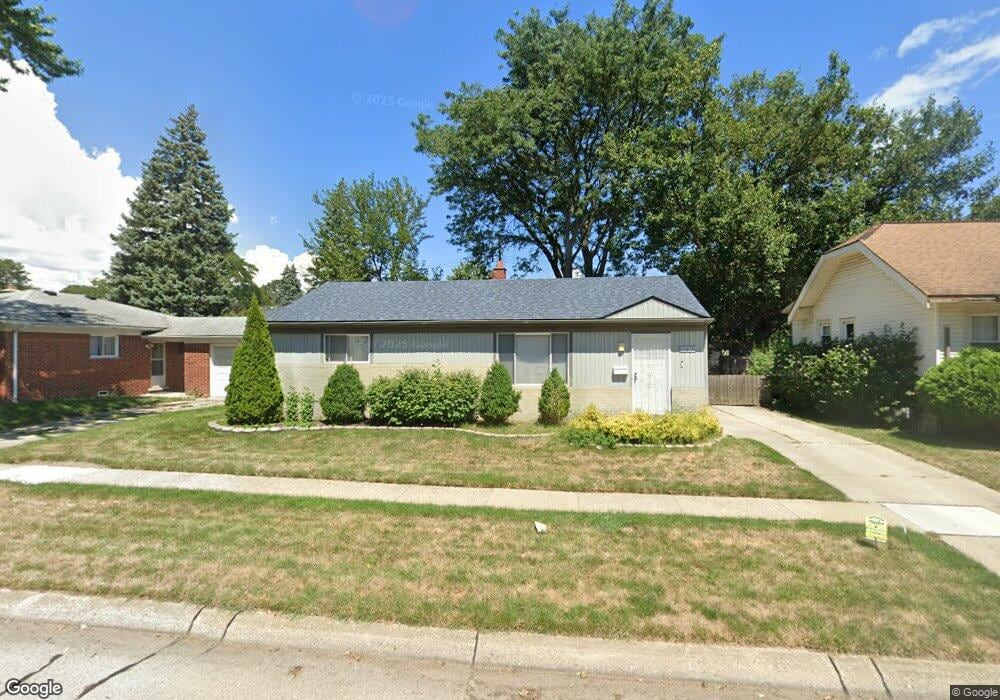
14811 Collinson Ave Eastpointe, MI 48021
Estimated Value: $93,000 - $131,000
2
Beds
1
Bath
964
Sq Ft
$114/Sq Ft
Est. Value
About This Home
This home is located at 14811 Collinson Ave, Eastpointe, MI 48021 and is currently estimated at $109,832, approximately $113 per square foot. 14811 Collinson Ave is a home located in Macomb County with nearby schools including Crescentwood Elementary School, Eastpointe Middle School, and Macomb Montessori Academy.
Ownership History
Date
Name
Owned For
Owner Type
Purchase Details
Closed on
Jul 13, 2023
Sold by
Palleschi Anthony
Bought by
Greater Detroit Realty Group Inc
Current Estimated Value
Purchase Details
Closed on
Sep 17, 2010
Sold by
Considine William
Bought by
Palleschi Anthony
Purchase Details
Closed on
Sep 26, 2006
Sold by
Niemi Eric
Bought by
Considine William
Purchase Details
Closed on
May 15, 2006
Sold by
Hud
Bought by
Niemi Eric
Purchase Details
Closed on
Oct 20, 2005
Sold by
Mortgage Electronic Registration Systems
Bought by
Hud
Purchase Details
Closed on
Apr 15, 2005
Sold by
Cook Robert and Cook Robert R
Bought by
Mortgage Electronic Registration Systems
Purchase Details
Closed on
Dec 18, 2000
Sold by
Laprarie Paul
Bought by
Cook Robert
Create a Home Valuation Report for This Property
The Home Valuation Report is an in-depth analysis detailing your home's value as well as a comparison with similar homes in the area
Home Values in the Area
Average Home Value in this Area
Purchase History
| Date | Buyer | Sale Price | Title Company |
|---|---|---|---|
| Greater Detroit Realty Group Inc | $80,000 | Liberty Title | |
| Greater Detroit Realty Group Inc | $80,000 | Liberty Title | |
| Palleschi Anthony | $14,900 | None Available | |
| Considine William | $95,400 | Clinton Valley Title Agency | |
| Niemi Eric | $62,700 | None Available | |
| Hud | -- | -- | |
| Mortgage Electronic Registration Systems | $87,927 | -- | |
| Cook Robert | $87,000 | -- |
Source: Public Records
Tax History
| Year | Tax Paid | Tax Assessment Tax Assessment Total Assessment is a certain percentage of the fair market value that is determined by local assessors to be the total taxable value of land and additions on the property. | Land | Improvement |
|---|---|---|---|---|
| 2025 | $4,103 | $52,000 | $0 | $0 |
| 2024 | $39 | $50,000 | $0 | $0 |
| 2023 | $1,611 | $40,900 | $0 | $0 |
| 2022 | $1,652 | $30,100 | $0 | $0 |
| 2021 | $1,626 | $29,900 | $0 | $0 |
| 2020 | $1,568 | $28,900 | $0 | $0 |
| 2019 | $1,555 | $22,400 | $0 | $0 |
| 2018 | $1,595 | $21,190 | $0 | $0 |
| 2017 | $1,492 | $21,670 | $3,290 | $18,380 |
| 2016 | $1,484 | $21,670 | $0 | $0 |
| 2015 | $1,158 | $18,250 | $0 | $0 |
| 2013 | $1,242 | $17,580 | $0 | $0 |
Source: Public Records
Map
Nearby Homes
- 14725 Agnes Ave
- 14700 Veronica Ave
- 14661 Lydia Ave
- 15003 Toepfer Dr
- 15065 Lincoln Ave
- 14611 Jacob Ave
- 21792 Elmwood Ave
- 21312 Dexter Blvd
- 15337 Veronica Ave
- 21734 Eastwood Ct
- 20947 Beechwood Ave
- 21315 La Salle Blvd
- 21756 Dexter Ct
- 22036 Birchwood Ave
- 22022 Beechwood Ave
- 0000 Elmwood Ave
- 22065 Linwood Ave
- 15628 Lincoln Ave
- 15534 Chestnut Ave
- 15705 Juliana Ave
- 14821 Collinson Ave
- 14799 Collinson Ave
- 14938 Veronica Ave
- 14928 Veronica Ave
- 14829 Collinson Ave
- 14918 Veronica Ave
- 14789 Collinson Ave
- 14837 Collinson Ave
- 14950 Veronica Ave
- 14908 Veronica Ave
- 14818 Collinson Ave
- 14802 Collinson Ave Unit Bldg-Unit
- 14802 Collinson Ave
- 14845 Collinson Ave
- 14826 Collinson Ave
- 14794 Collinson Ave
- 14960 Veronica Ave
- 14834 Collinson Ave
- 14900 Veronica Ave
- 14786 Collinson Ave
Your Personal Tour Guide
Ask me questions while you tour the home.