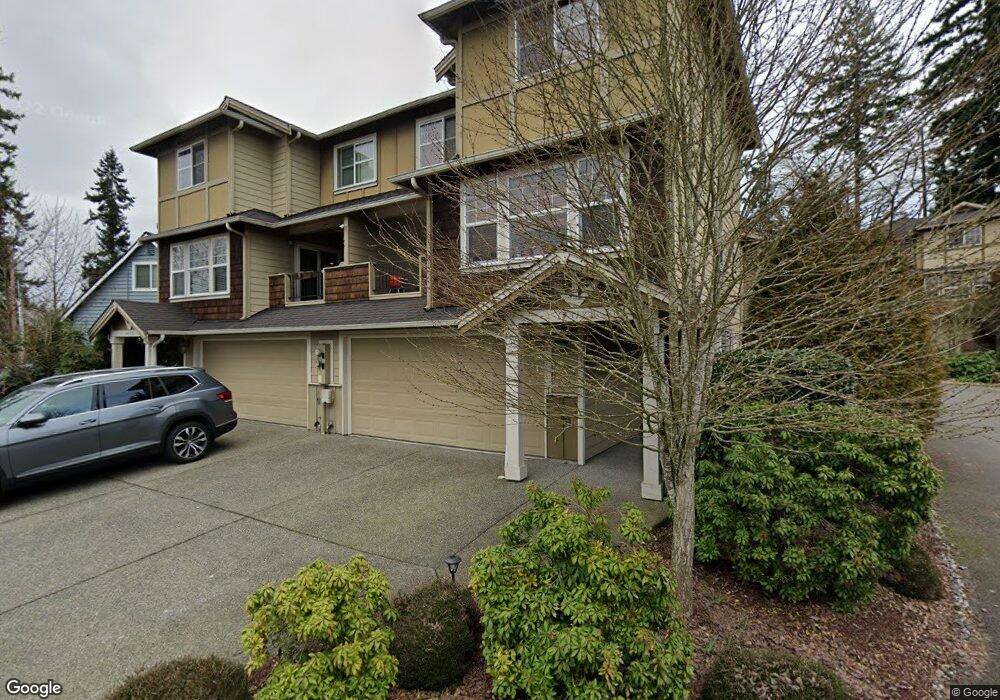
14813 11th Place W Unit B Lynnwood, WA 98087
North Lynnwood NeighborhoodEstimated Value: $656,000 - $807,000
3
Beds
4
Baths
2,145
Sq Ft
$330/Sq Ft
Est. Value
About This Home
This home is located at 14813 11th Place W Unit B, Lynnwood, WA 98087 and is currently estimated at $706,832, approximately $329 per square foot. 14813 11th Place W Unit B is a home located in Snohomish County with nearby schools including Oak Heights Elementary School, Alderwood Middle School, and Lynnwood High School.
Ownership History
Date
Name
Owned For
Owner Type
Purchase Details
Closed on
May 5, 2019
Sold by
Breuder Maria
Bought by
Breuder Maria and Breuder Paul
Current Estimated Value
Home Financials for this Owner
Home Financials are based on the most recent Mortgage that was taken out on this home.
Original Mortgage
$259,000
Outstanding Balance
$168,140
Interest Rate
4%
Mortgage Type
New Conventional
Estimated Equity
$538,692
Purchase Details
Closed on
Dec 17, 2009
Sold by
Ashborough Condominium Llc
Bought by
Rodriguez Jose L and Rodriguez Maria L
Home Financials for this Owner
Home Financials are based on the most recent Mortgage that was taken out on this home.
Original Mortgage
$265,109
Interest Rate
4.91%
Mortgage Type
FHA
Purchase Details
Closed on
Apr 8, 2009
Sold by
Ashborough Llc
Bought by
Brueder Maria
Create a Home Valuation Report for This Property
The Home Valuation Report is an in-depth analysis detailing your home's value as well as a comparison with similar homes in the area
Home Values in the Area
Average Home Value in this Area
Purchase History
| Date | Buyer | Sale Price | Title Company |
|---|---|---|---|
| Breuder Maria | $81,433 | Servicelink | |
| Rodriguez Jose L | $270,000 | Chicago Title | |
| Brueder Maria | $300,230 | Chicago Title |
Source: Public Records
Mortgage History
| Date | Status | Borrower | Loan Amount |
|---|---|---|---|
| Open | Breuder Maria | $259,000 | |
| Previous Owner | Rodriguez Jose L | $265,109 |
Source: Public Records
Tax History Compared to Growth
Tax History
| Year | Tax Paid | Tax Assessment Tax Assessment Total Assessment is a certain percentage of the fair market value that is determined by local assessors to be the total taxable value of land and additions on the property. | Land | Improvement |
|---|---|---|---|---|
| 2025 | $4,879 | $602,100 | $305,900 | $296,200 |
| 2024 | $4,879 | $583,100 | $286,900 | $296,200 |
| 2023 | $4,970 | $621,000 | $279,900 | $341,100 |
| 2022 | $4,620 | $469,700 | $185,400 | $284,300 |
| 2020 | $4,491 | $405,500 | $162,900 | $242,600 |
| 2019 | $4,009 | $359,500 | $118,800 | $240,700 |
| 2018 | $4,215 | $333,600 | $117,000 | $216,600 |
| 2017 | $3,594 | $293,900 | $88,200 | $205,700 |
| 2016 | $3,275 | $268,300 | $69,300 | $199,000 |
| 2015 | $3,203 | $249,300 | $58,500 | $190,800 |
| 2013 | $2,879 | $212,500 | $48,600 | $163,900 |
Source: Public Records
Map
Nearby Homes
- 15908 12th Place W
- 15110 13th Park W Unit 25
- 14901 8th Place W
- 14332 Madison Way
- 14424 Madison Way Unit E3
- 14424 Madison Way Unit G5
- 14424 Madison Way Unit E6
- 14424 Madison Way Unit E4
- 14424 Madison Way Unit G3
- 14424 Madison Way Unit G6
- 14424 Madison Way Unit G4
- 14424 Madison Way Unit G2
- 14424 Madison Way Unit G1
- Design 3 Plan at Bruntsfield Townhomes
- Design 2 Plan at Bruntsfield Townhomes
- Design 1 Plan at Bruntsfield Townhomes
- 1532 145th Place SW Unit A
- 1328 152nd Place SW
- 15404 Meadow Rd
- 14523 16th Park W Unit B
- 14813 11th Place W Unit A
- 14813 11th Place W
- 14803 Ash Way Unit 16
- 14818 11th Place W Unit A
- 14818 11th Place W Unit B
- 14808 11th Place W Unit ID1324814P
- 14808 11th Place W Unit A
- 14808 11th Place W Unit B
- 14808 11th Place W Unit C
- 14808 11th Place W
- 14826 11th Place W Unit A
- 14826 11th Place W Unit B
- 14814 11th Place W Unit A
- 14814 11th Place W
- 14822 11th Place W Unit A
- 14822 11th Place W Unit B
- 14830 11th Place W Unit A
- 14830 11th Place W Unit B
- 14830 11th Place W Unit B
- 14815 Ash Way