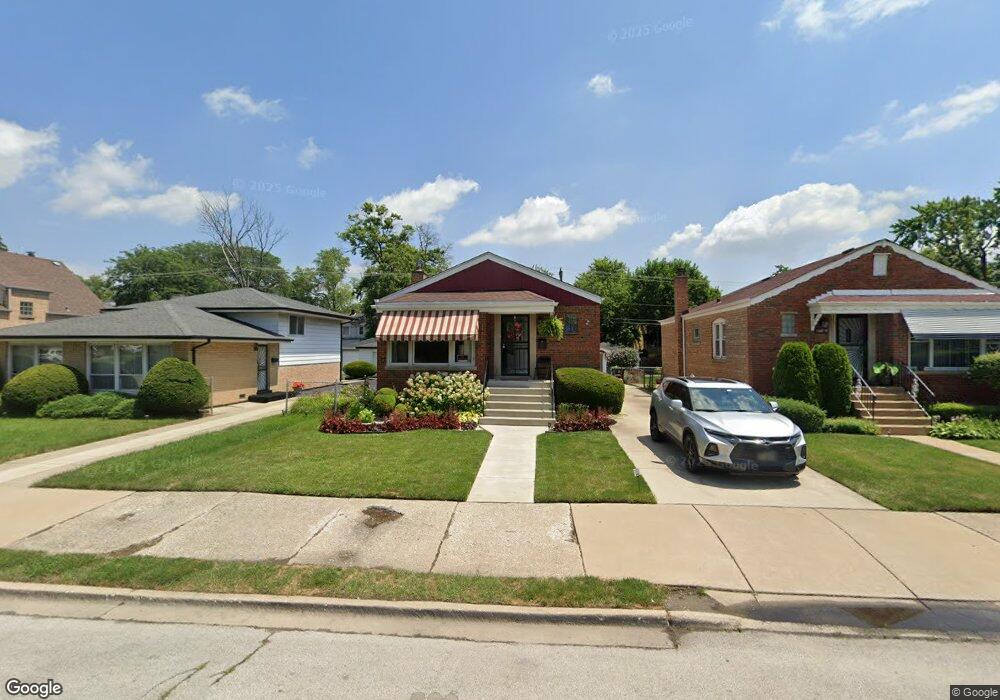
14815 Chicago Rd Dolton, IL 60419
Estimated Value: $141,757 - $169,000
3
Beds
2
Baths
1,064
Sq Ft
$147/Sq Ft
Est. Value
About This Home
This home is located at 14815 Chicago Rd, Dolton, IL 60419 and is currently estimated at $156,439, approximately $147 per square foot. 14815 Chicago Rd is a home located in Cook County with nearby schools including Franklin Elementary School, Lincoln Junior High School, and Thornridge High School.
Ownership History
Date
Name
Owned For
Owner Type
Purchase Details
Closed on
Apr 26, 2007
Sold by
Wilson Claudel and Wilson Ora
Bought by
Gant Thelma D
Current Estimated Value
Home Financials for this Owner
Home Financials are based on the most recent Mortgage that was taken out on this home.
Original Mortgage
$125,910
Outstanding Balance
$75,202
Interest Rate
6.2%
Mortgage Type
Unknown
Estimated Equity
$81,237
Purchase Details
Closed on
Jun 23, 2000
Sold by
Ikejimba Bridget C
Bought by
Wilson Claudel and Wilson Ora
Home Financials for this Owner
Home Financials are based on the most recent Mortgage that was taken out on this home.
Original Mortgage
$74,700
Interest Rate
7.9%
Purchase Details
Closed on
Oct 20, 1993
Sold by
Magnuson James E
Bought by
Ikejimba Bridget C and Ikejimba Dann
Home Financials for this Owner
Home Financials are based on the most recent Mortgage that was taken out on this home.
Original Mortgage
$63,396
Interest Rate
6.93%
Mortgage Type
FHA
Create a Home Valuation Report for This Property
The Home Valuation Report is an in-depth analysis detailing your home's value as well as a comparison with similar homes in the area
Home Values in the Area
Average Home Value in this Area
Purchase History
We collect this data history from publicly available records. To have your information removed, we recommend requesting removal directly through your county’s website.
| Date | Buyer | Sale Price | Title Company |
|---|---|---|---|
| Gant Thelma D | $140,000 | Pntn | |
| Wilson Claudel | -- | -- | |
| Ikejimba Bridget C | $42,000 | -- |
Source: Public Records
Mortgage History
We collect this data history from publicly available records. To have your information removed, we recommend requesting removal directly through your county’s website.
| Date | Status | Borrower | Loan Amount |
|---|---|---|---|
| Open | Gant Thelma D | $125,910 | |
| Previous Owner | Wilson Claudel | $74,700 | |
| Previous Owner | Ikejimba Bridget C | $63,396 |
Source: Public Records
Tax History
| Year | Tax Paid | Tax Assessment Tax Assessment Total Assessment is a certain percentage of the fair market value that is determined by local assessors to be the total taxable value of land and additions on the property. | Land | Improvement |
|---|---|---|---|---|
| 2025 | $5,276 | $10,014 | $2,108 | $7,906 |
| 2024 | $5,276 | $10,014 | $2,108 | $7,906 |
| 2023 | $3,788 | $12,000 | $2,108 | $9,892 |
| 2022 | $3,788 | $8,571 | $1,860 | $6,711 |
| 2021 | $4,392 | $8,570 | $1,860 | $6,710 |
| 2020 | $4,331 | $8,570 | $1,860 | $6,710 |
| 2019 | $3,757 | $7,716 | $1,736 | $5,980 |
| 2018 | $3,640 | $7,716 | $1,736 | $5,980 |
| 2017 | $3,474 | $7,716 | $1,736 | $5,980 |
| 2016 | $4,074 | $8,054 | $1,612 | $6,442 |
| 2015 | $3,860 | $8,054 | $1,612 | $6,442 |
| 2014 | $3,869 | $8,054 | $1,612 | $6,442 |
| 2013 | $3,672 | $8,293 | $1,612 | $6,681 |
Source: Public Records
Map
Nearby Homes
- 14806 Grant St
- 14823 Grant St
- 14909 Martin Luther King jr Dr
- 14819 Evers St
- 14701 Beachview Terrace
- 14900 Oak St
- 14640 Doctor Martin Luther King Junior Dr
- 14800 Irving Ave
- 14940 Oak St
- 14930 Irving Ave
- 14838 Champlain St
- 15019 Evers St
- 505 E 146th St
- 520 E 146th St
- 14832 Langley Ave
- 14528 Grant St
- 15029 Irving Ave
- 440 Engle St
- 14845 Evans Ave
- 14435 Martin Luther King jr Dr
- 14819 Chicago Rd
- 14811 Chicago Rd
- 14811 Chicago Rd
- 14821 Chicago Rd
- 14807 Chicago Rd
- 14807 Doctor Martin Luther King Junior Dr
- 14825 Chicago Rd
- 14805 Chicago Rd
- 14805 Doctor Martin Luther King Junior Dr
- 14805 Martin Luther King jr Dr
- 14812 Grant St
- 14816 Grant St
- 14810 Grant St
- 14818 Grant St
- 14827 Chicago Rd
- 14822 Grant St
- 14802 Grant St
- 14826 Grant St
- 14818 Doctor Martin Luther King Junior Dr
- 14806 Chicago Rd
Your Personal Tour Guide
Ask me questions while you tour the home.