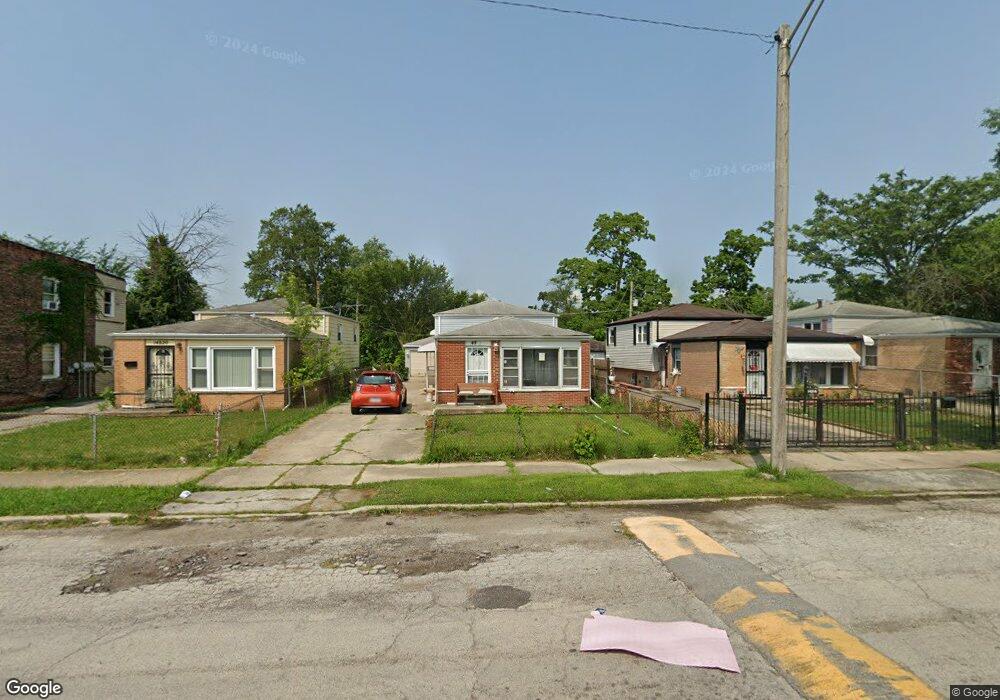
14816 Page Ave Harvey, IL 60426
Estimated Value: $78,000 - $97,132
3
Beds
2
Baths
919
Sq Ft
$99/Sq Ft
Est. Value
About This Home
This home is located at 14816 Page Ave, Harvey, IL 60426 and is currently estimated at $91,283, approximately $99 per square foot. 14816 Page Ave is a home located in Cook County with nearby schools including Thornton Township High School and Academic Mastery Academy.
Ownership History
Date
Name
Owned For
Owner Type
Purchase Details
Closed on
Mar 6, 2024
Sold by
Smith Bobby R and Smith Cynthia A
Bought by
Ramirez Ricardo Ruiz and Martinez Anabel Meza
Current Estimated Value
Purchase Details
Closed on
Oct 11, 2006
Sold by
Lasalle Bank Na
Bought by
Smith Bobby R and Smith Cynthia A
Purchase Details
Closed on
May 10, 2006
Sold by
Jones Althea
Bought by
Lasalle Bank Na
Purchase Details
Closed on
Feb 17, 2004
Sold by
Jones Lee and Jones Althea
Bought by
Jones Althea
Home Financials for this Owner
Home Financials are based on the most recent Mortgage that was taken out on this home.
Original Mortgage
$68,000
Interest Rate
9.7%
Mortgage Type
New Conventional
Purchase Details
Closed on
Apr 13, 1998
Sold by
Robinson Janet and Milam Jean
Bought by
Jones Lee and Jones Althea
Home Financials for this Owner
Home Financials are based on the most recent Mortgage that was taken out on this home.
Original Mortgage
$66,450
Interest Rate
7.2%
Create a Home Valuation Report for This Property
The Home Valuation Report is an in-depth analysis detailing your home's value as well as a comparison with similar homes in the area
Home Values in the Area
Average Home Value in this Area
Purchase History
| Date | Buyer | Sale Price | Title Company |
|---|---|---|---|
| Ramirez Ricardo Ruiz | $10,000 | First American Title | |
| Smith Bobby R | $65,000 | None Available | |
| Lasalle Bank Na | -- | None Available | |
| Jones Althea | -- | Stewart Title Guaranty Compa | |
| Jones Lee | $66,500 | Professional National Title |
Source: Public Records
Mortgage History
| Date | Status | Borrower | Loan Amount |
|---|---|---|---|
| Previous Owner | Jones Althea | $68,000 | |
| Previous Owner | Jones Lee | $66,450 |
Source: Public Records
Tax History Compared to Growth
Tax History
| Year | Tax Paid | Tax Assessment Tax Assessment Total Assessment is a certain percentage of the fair market value that is determined by local assessors to be the total taxable value of land and additions on the property. | Land | Improvement |
|---|---|---|---|---|
| 2024 | $4,327 | $6,100 | $1,289 | $4,811 |
| 2023 | $3,342 | $6,100 | $1,289 | $4,811 |
| 2022 | $3,342 | $3,860 | $1,289 | $2,571 |
| 2021 | $3,268 | $3,859 | $1,288 | $2,571 |
| 2020 | $3,171 | $3,859 | $1,288 | $2,571 |
| 2019 | $3,980 | $4,908 | $1,171 | $3,737 |
| 2018 | $3,854 | $4,908 | $1,171 | $3,737 |
| 2017 | $3,790 | $4,908 | $1,171 | $3,737 |
| 2016 | $3,776 | $5,226 | $1,054 | $4,172 |
| 2015 | $3,632 | $5,226 | $1,054 | $4,172 |
| 2014 | $3,614 | $5,226 | $1,054 | $4,172 |
| 2013 | $3,570 | $5,603 | $1,054 | $4,549 |
Source: Public Records
Map
Nearby Homes
- 14727 Wood St
- 14807 Paulina St
- 14910 S Wood St
- 14911 Page Ave
- 14806 Lincoln Ave
- 14921 Lincoln Ave
- 110 W 150th St
- 14826 Robey Ave
- 147 W 150th St
- 14900 Vine Ave
- 15033 Paulina St
- 14564 Spaulding Ave
- 15032 Marshfield Ave
- 15032 Winchester Ave
- 14735 Myrtle Ave
- 15012 Seeley Ave
- 14839 Cooper Ave
- 15131 Winchester Ave
- 15018 Myrtle Ave
- 36 E 151st St
- 14820 Page Ave
- 14814 Page Ave
- 14822 Page Ave
- 14810 Page Ave
- 14826 Page Ave
- 14817 Wood St
- 14819 Wood St
- 14813 Wood St
- 14830 Page Ave
- 14809 Wood St
- 14809 Wood St
- 14800 Page Ave
- 14827 Wood St
- 14807 Wood St
- 14803 Wood St
- 14801 Wood St
- 14839 Wood St
- 14822 S Wood St Unit 3
- 14822 S Wood St Unit 2
- 14822 S Wood St Unit 1