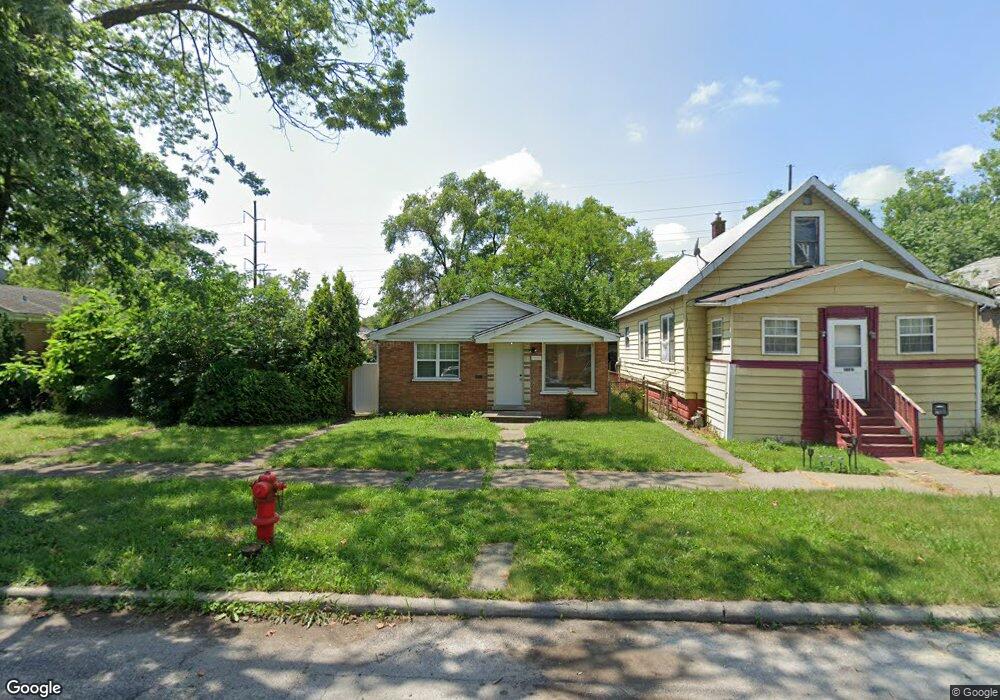
14818 Winchester Ave Harvey, IL 60426
Estimated Value: $73,000 - $100,991
3
Beds
1
Bath
1,025
Sq Ft
$86/Sq Ft
Est. Value
About This Home
This home is located at 14818 Winchester Ave, Harvey, IL 60426 and is currently estimated at $87,748, approximately $85 per square foot. 14818 Winchester Ave is a home located in Cook County with nearby schools including Thornton Township High School and Academic Mastery Academy.
Ownership History
Date
Name
Owned For
Owner Type
Purchase Details
Closed on
May 1, 2006
Sold by
Pollard Nicole
Bought by
Howard Philip
Current Estimated Value
Home Financials for this Owner
Home Financials are based on the most recent Mortgage that was taken out on this home.
Original Mortgage
$68,000
Outstanding Balance
$44,619
Interest Rate
8.85%
Mortgage Type
Unknown
Estimated Equity
$43,129
Purchase Details
Closed on
Dec 19, 2005
Sold by
Hud
Bought by
Muhammad Jessica
Purchase Details
Closed on
May 27, 2004
Sold by
Hud
Bought by
Pollard Nicole
Home Financials for this Owner
Home Financials are based on the most recent Mortgage that was taken out on this home.
Original Mortgage
$40,850
Interest Rate
6.06%
Mortgage Type
Unknown
Purchase Details
Closed on
Nov 3, 2003
Sold by
Franklin Yvette C
Bought by
Hud
Create a Home Valuation Report for This Property
The Home Valuation Report is an in-depth analysis detailing your home's value as well as a comparison with similar homes in the area
Home Values in the Area
Average Home Value in this Area
Purchase History
| Date | Buyer | Sale Price | Title Company |
|---|---|---|---|
| Howard Philip | $64,000 | None Available | |
| Muhammad Jessica | -- | Stewart Title Of Illinois | |
| Pollard Nicole | -- | Stewart Title Of Illinois | |
| Hud | -- | Torrens Titles |
Source: Public Records
Mortgage History
| Date | Status | Borrower | Loan Amount |
|---|---|---|---|
| Open | Howard Philip | $68,000 | |
| Previous Owner | Pollard Nicole | $40,850 |
Source: Public Records
Tax History Compared to Growth
Tax History
| Year | Tax Paid | Tax Assessment Tax Assessment Total Assessment is a certain percentage of the fair market value that is determined by local assessors to be the total taxable value of land and additions on the property. | Land | Improvement |
|---|---|---|---|---|
| 2024 | $1,549 | $5,500 | $1,146 | $4,354 |
| 2023 | $615 | $5,500 | $1,146 | $4,354 |
| 2022 | $615 | $4,132 | $1,146 | $2,986 |
| 2021 | $677 | $4,130 | $1,145 | $2,985 |
| 2020 | $844 | $4,130 | $1,145 | $2,985 |
| 2019 | $1,453 | $5,221 | $1,041 | $4,180 |
| 2018 | $1,402 | $5,221 | $1,041 | $4,180 |
| 2017 | $1,425 | $5,221 | $1,041 | $4,180 |
| 2016 | $2,057 | $5,344 | $937 | $4,407 |
| 2015 | $1,891 | $5,344 | $937 | $4,407 |
| 2014 | $1,919 | $5,344 | $937 | $4,407 |
| 2013 | $1,620 | $5,172 | $937 | $4,235 |
Source: Public Records
Map
Nearby Homes
- 14826 Robey Ave
- 14806 Lincoln Ave
- 14921 Lincoln Ave
- 147 W 150th St
- 14910 S Wood St
- 14839 Cooper Ave
- 14727 Wood St
- 110 W 150th St
- 15012 Seeley Ave
- 15032 Winchester Ave
- 14913 Leavitt Ave
- 14911 Page Ave
- 14564 Spaulding Ave
- 14924 Leavitt Ave
- 14807 Paulina St
- 15131 Winchester Ave
- 15033 Paulina St
- 14514 Cooper Ave
- 15032 Marshfield Ave
- 14900 Vine Ave
- 14816 Winchester Ave
- 14814 Winchester Ave
- 14824 Winchester Ave
- 14812 Winchester Ave
- 14830 Winchester Ave
- 14830 Winchester Ave
- 14808 Winchester Ave
- 14819 Robey Ave
- 14832 Winchester Ave
- 14832 Winchester Ave
- 14804 Winchester Ave
- 14821 Winchester Ave
- 14817 Winchester Ave
- 14815 Winchester Ave
- 14825 Winchester Ave
- 14827 Winchester Ave
- 14811 Winchester Ave
- 14834 Winchester Ave
- 14809 Winchester Ave
- 14829 Winchester Ave