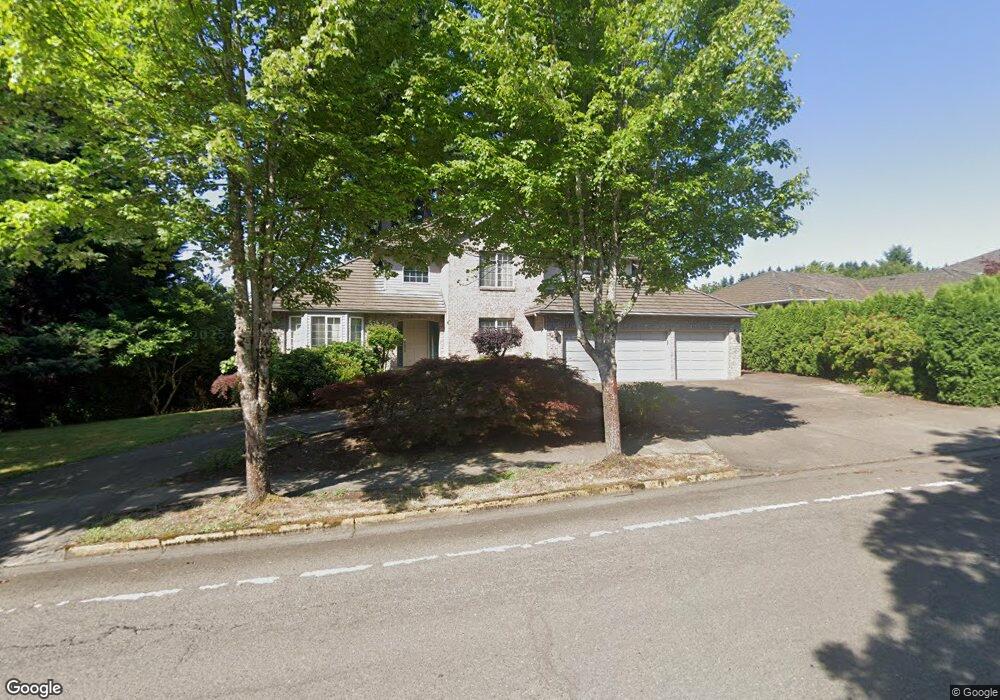
14819 SE 132nd Ave Clackamas, OR 97015
Estimated Value: $697,000 - $759,000
4
Beds
3
Baths
2,453
Sq Ft
$297/Sq Ft
Est. Value
About This Home
This home is located at 14819 SE 132nd Ave, Clackamas, OR 97015 and is currently estimated at $729,289, approximately $297 per square foot. 14819 SE 132nd Ave is a home located in Clackamas County with nearby schools including Oregon Trail Elementary School, Rock Creek Middle School, and Clackamas High School.
Ownership History
Date
Name
Owned For
Owner Type
Purchase Details
Closed on
Jun 5, 2015
Sold by
Helbig Mark and Helbig Cathy
Bought by
Guo Xiqiang and He Meiyuan
Current Estimated Value
Home Financials for this Owner
Home Financials are based on the most recent Mortgage that was taken out on this home.
Original Mortgage
$368,100
Outstanding Balance
$283,159
Interest Rate
3.64%
Mortgage Type
New Conventional
Estimated Equity
$446,130
Purchase Details
Closed on
Jun 17, 2005
Sold by
Sweet Stanley and Sweet Leonore
Bought by
Helbig Mark and Helbig Cathy
Home Financials for this Owner
Home Financials are based on the most recent Mortgage that was taken out on this home.
Original Mortgage
$310,000
Interest Rate
5.72%
Mortgage Type
Fannie Mae Freddie Mac
Purchase Details
Closed on
Nov 9, 1998
Sold by
Sweet Leonore C
Bought by
Sweet Stanley and Sweet Leonore
Create a Home Valuation Report for This Property
The Home Valuation Report is an in-depth analysis detailing your home's value as well as a comparison with similar homes in the area
Home Values in the Area
Average Home Value in this Area
Purchase History
| Date | Buyer | Sale Price | Title Company |
|---|---|---|---|
| Guo Xiqiang | $409,000 | Stewart Title | |
| Helbig Mark | $415,000 | Fidelity Natl Title Co Of Or | |
| Sweet Stanley | -- | -- |
Source: Public Records
Mortgage History
| Date | Status | Borrower | Loan Amount |
|---|---|---|---|
| Open | Guo Xiqiang | $368,100 | |
| Previous Owner | Helbig Mark | $310,000 |
Source: Public Records
Tax History Compared to Growth
Tax History
| Year | Tax Paid | Tax Assessment Tax Assessment Total Assessment is a certain percentage of the fair market value that is determined by local assessors to be the total taxable value of land and additions on the property. | Land | Improvement |
|---|---|---|---|---|
| 2025 | $9,202 | $484,650 | -- | -- |
| 2024 | $8,876 | $470,534 | -- | -- |
| 2023 | $8,876 | $456,830 | $0 | $0 |
| 2022 | $8,162 | $443,525 | $0 | $0 |
| 2021 | $7,832 | $430,607 | $0 | $0 |
| 2020 | $7,340 | $418,066 | $0 | $0 |
| 2019 | $7,266 | $405,890 | $0 | $0 |
| 2018 | $6,569 | $394,068 | $0 | $0 |
| 2017 | $6,359 | $382,590 | $0 | $0 |
| 2016 | $6,132 | $371,447 | $0 | $0 |
| 2015 | $5,944 | $360,628 | $0 | $0 |
| 2014 | -- | $350,124 | $0 | $0 |
Source: Public Records
Map
Nearby Homes
- 14734 SE 131st Dr
- 14646 SE Megan Way
- 14880 SE Marci Way
- 14198 SE Iseli Ln
- 14196 SE Iseli Ln
- 14192 SE Iseli Ln
- 14194 SE Iseli Ln
- 17303 SE 130th Ave
- 14890 SE Lostine Dr
- 12064 SE Grand Vista Dr
- 13900 SE Highway 212
- 13900 SE Highway 212 Unit 62
- 13900 SE Highway 212 Unit 125
- 13900 SE Highway 212 Unit 181
- 13900 SE Highway 212 Unit 190
- 13900 SE Highway 212 Unit 16
- 13900 SE Highway 212 Unit 185
- 13640 SE Highway 212 Unit 39
- 13640 SE Highway 212 Unit 121
- 13640 SE Highway 212 Unit 46
- 13221 SE Comanche Ct
- 14785 SE 132nd Ave
- 14822 SE 132nd Ave
- 13300 SE Kaitlin Way
- 13224 SE Comanche Ct
- 13213 SE Comanche Ct
- 14759 SE 132nd Ave
- 14895 SE Megan Way
- 13356 SE Kaitlin Way
- 13275 SE Kaitlin Way
- 13218 SE Comanche Ct
- 14829 SE Megan Way
- 13207 SE Comanche Ct
- 14741 SE 132nd Ave
- 14911 SE Megan Way
- 13331 SE Kaitlin Way
- 13210 SE Comanche Ct
- 14805 SE Megan Way
- 12945 SE
- 12430 SE Sydney Ln-Relisted