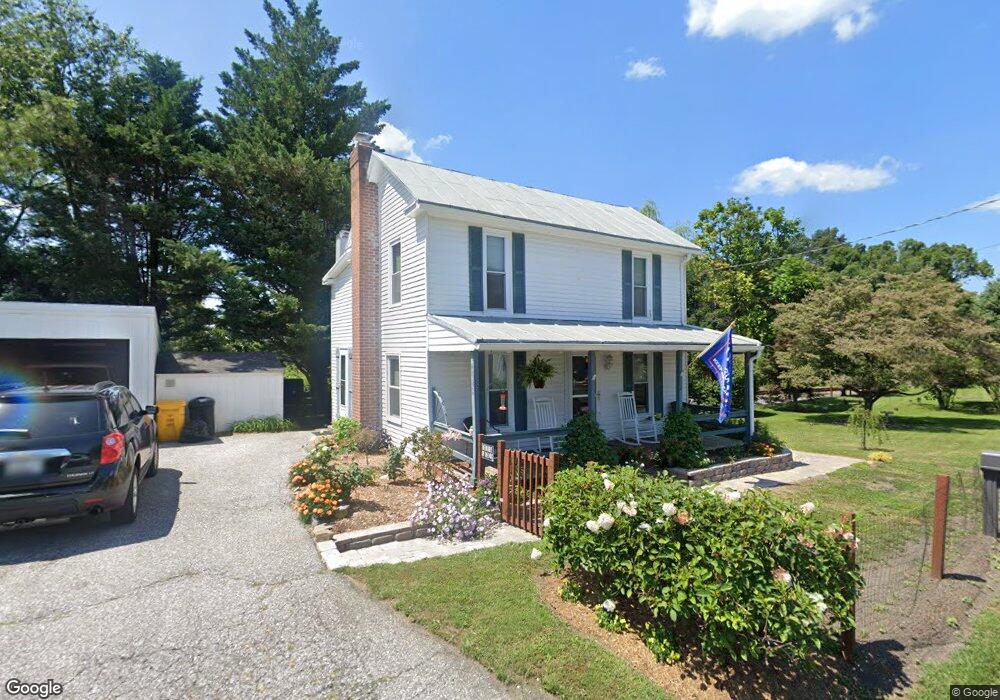
14822 Old Hanover Rd Upperco, MD 21155
Estimated Value: $292,000 - $334,000
3
Beds
1
Bath
1,104
Sq Ft
$278/Sq Ft
Est. Value
About This Home
This home is located at 14822 Old Hanover Rd, Upperco, MD 21155 and is currently estimated at $306,858, approximately $277 per square foot. 14822 Old Hanover Rd is a home located in Baltimore County with nearby schools including Franklin Elementary School, Franklin Middle, and Franklin High.
Ownership History
Date
Name
Owned For
Owner Type
Purchase Details
Closed on
Jun 29, 2017
Sold by
Cunningham Jason R and Cunningham Wendy N
Bought by
Fink Lawrence and Schoberg Angela Marie
Current Estimated Value
Home Financials for this Owner
Home Financials are based on the most recent Mortgage that was taken out on this home.
Original Mortgage
$150,000
Outstanding Balance
$125,068
Interest Rate
4.02%
Mortgage Type
New Conventional
Estimated Equity
$181,790
Purchase Details
Closed on
Oct 26, 2000
Sold by
Hafner Holger
Bought by
Cunningham Jason R and Hruska Wendy N
Purchase Details
Closed on
Dec 6, 1996
Sold by
Ziman Bruce D
Bought by
Hafner Holger and Bohli Hafner Suzanne E
Purchase Details
Closed on
Jan 26, 1994
Sold by
Pusey Mary J
Bought by
Ziman Bruce D
Home Financials for this Owner
Home Financials are based on the most recent Mortgage that was taken out on this home.
Original Mortgage
$87,086
Interest Rate
7.11%
Create a Home Valuation Report for This Property
The Home Valuation Report is an in-depth analysis detailing your home's value as well as a comparison with similar homes in the area
Purchase History
| Date | Buyer | Sale Price | Title Company |
|---|---|---|---|
| Fink Lawrence | $187,500 | Old Republic Natl Ins Co | |
| Cunningham Jason R | $109,900 | -- | |
| Hafner Holger | $96,000 | -- | |
| Ziman Bruce D | $86,500 | -- |
Source: Public Records
Mortgage History
| Date | Status | Borrower | Loan Amount |
|---|---|---|---|
| Open | Fink Lawrence | $150,000 | |
| Closed | Fink Lawrence | $150,000 | |
| Previous Owner | Ziman Bruce D | $87,086 |
Source: Public Records
Tax History
| Year | Tax Paid | Tax Assessment Tax Assessment Total Assessment is a certain percentage of the fair market value that is determined by local assessors to be the total taxable value of land and additions on the property. | Land | Improvement |
|---|---|---|---|---|
| 2025 | $2,025 | $187,867 | -- | -- |
| 2024 | $2,025 | $163,600 | $68,600 | $95,000 |
| 2023 | $2,036 | $163,000 | $0 | $0 |
| 2022 | $2,010 | $162,400 | $0 | $0 |
| 2021 | $1,939 | $161,800 | $68,600 | $93,200 |
| 2020 | $1,939 | $155,033 | $0 | $0 |
| 2019 | $1,857 | $148,267 | $0 | $0 |
| 2018 | $1,775 | $141,500 | $68,600 | $72,900 |
| 2017 | $1,759 | $141,500 | $0 | $0 |
| 2016 | $1,661 | $141,500 | $0 | $0 |
| 2015 | $1,661 | $141,500 | $0 | $0 |
| 2014 | $1,661 | $141,500 | $0 | $0 |
Source: Public Records
Map
Nearby Homes
- 14628 Old Hanover Rd Unit REGINA
- 14628 Old Hanover Rd Unit BENTON
- 14628 Old Hanover Rd Unit RAINIER
- 14628 Old Hanover Rd Unit TULARE
- 17 Mamopa Ct
- 14500 Hanover Pike
- 4224 Piney Grove Rd
- 13915 Hanover Pike
- 13816 Hanover Pike
- 15910 Dark Hollow Rd
- 0 Dover Rd Unit MDBC2012792
- 3600 Butler Rd
- 3500 Lawndale Rd E
- 110 Lees Mill Rd
- 3360 Lawndale Rd
- 16306 Trenton Rd
- 16338 Trenton Rd
- 3114 Mount Zion Rd
- 13312 Hanover Pike
- 3300 Dornoch Dr
- 14822 Old Hanover Rd
- 14819 Old Hanover Rd
- 14823 Old Hanover Rd
- 14823 Old Hanover Rd
- 14817 Old Hanover Rd
- 14827 Old Hanover Rd
- 14815 Old Hanover Rd
- 14814 Old Hanover Rd
- 14813 Old Hanover Rd
- 14811 Old Hanover Rd
- 14807 Old Hanover Rd
- 14829 Old Hanover Rd
- 15319 Old Hanover Rd
- 4932 Pleasant Grove Rd
- 14802 Old Hanover Rd
- 4938 Pleasant Grove Rd
- 4924 Pleasant Grove Rd
- 0 Pleasant Grove Rd Unit BC7831800
- 0 Pleasant Grove Rd Unit 1009583716
- 4937 Pleasant Grove Rd
Your Personal Tour Guide
Ask me questions while you tour the home.