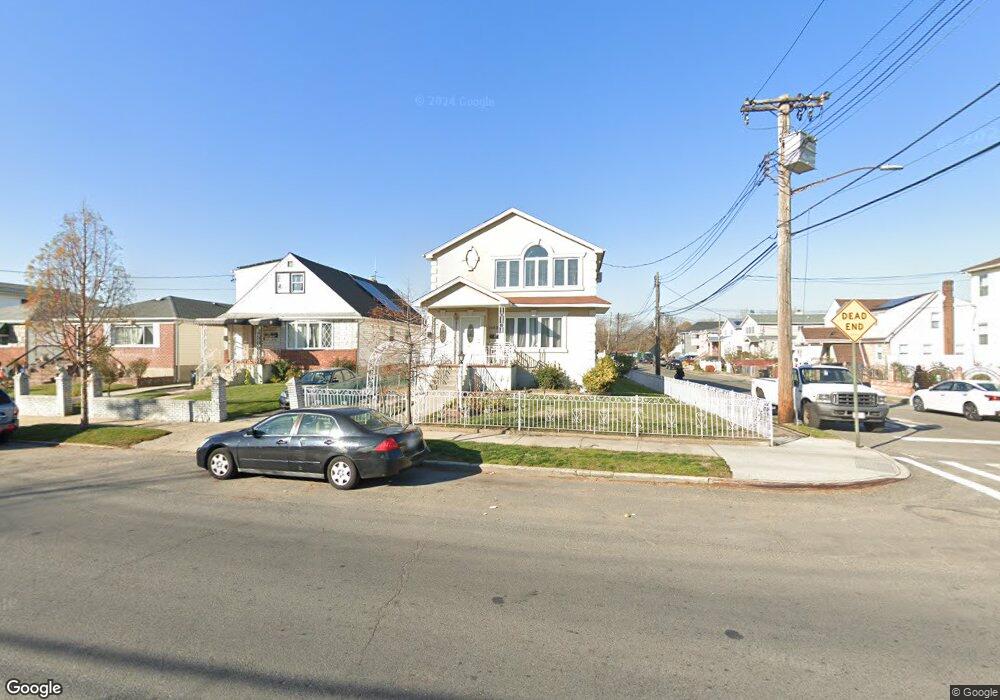
14828 Brookville Blvd Rosedale, NY 11422
Rosedale NeighborhoodEstimated Value: $679,000 - $810,000
--
Bed
--
Bath
1,274
Sq Ft
$608/Sq Ft
Est. Value
About This Home
This home is located at 14828 Brookville Blvd, Rosedale, NY 11422 and is currently estimated at $775,131, approximately $608 per square foot. 14828 Brookville Blvd is a home located in Queens County with nearby schools including P.S. 181 Brookfield, Collaborative Arts Middle School, and Success Academy Charter School - Rosedale.
Ownership History
Date
Name
Owned For
Owner Type
Purchase Details
Closed on
Jun 1, 2016
Sold by
Belmonte Alex J and Belmonte Trustee Umberto
Bought by
Carr Beverly and Carr Shimica
Current Estimated Value
Home Financials for this Owner
Home Financials are based on the most recent Mortgage that was taken out on this home.
Original Mortgage
$518,200
Outstanding Balance
$410,730
Interest Rate
3.61%
Mortgage Type
New Conventional
Estimated Equity
$364,401
Purchase Details
Closed on
Jan 15, 2008
Sold by
Belmonte Trustee Umberto and Umberto Belmonte Self Declaration Of Liv
Bought by
Belmonte Alex J and Belmonte Trustee Umberto
Purchase Details
Closed on
Dec 16, 2003
Sold by
Belmonte Umberto
Bought by
Umberto Belmonte As Trustee
Create a Home Valuation Report for This Property
The Home Valuation Report is an in-depth analysis detailing your home's value as well as a comparison with similar homes in the area
Home Values in the Area
Average Home Value in this Area
Purchase History
| Date | Buyer | Sale Price | Title Company |
|---|---|---|---|
| Carr Beverly | $612,000 | -- | |
| Carr Beverly | $612,000 | -- | |
| Belmonte Alex J | -- | -- | |
| Belmonte Alex J | -- | -- | |
| Umberto Belmonte As Trustee | -- | -- | |
| Umberto Belmonte As Trustee | -- | -- |
Source: Public Records
Mortgage History
| Date | Status | Borrower | Loan Amount |
|---|---|---|---|
| Open | Carr Beverly | $518,200 | |
| Closed | Carr Beverly | $518,200 | |
| Closed | Belmonte Alex J | $0 |
Source: Public Records
Tax History Compared to Growth
Tax History
| Year | Tax Paid | Tax Assessment Tax Assessment Total Assessment is a certain percentage of the fair market value that is determined by local assessors to be the total taxable value of land and additions on the property. | Land | Improvement |
|---|---|---|---|---|
| 2025 | $5,362 | $26,698 | $6,551 | $20,147 |
| 2024 | $5,362 | $26,698 | $6,191 | $20,507 |
| 2023 | $5,322 | $26,496 | $6,771 | $19,725 |
| 2022 | $4,990 | $36,300 | $10,380 | $25,920 |
| 2021 | $4,963 | $31,500 | $10,380 | $21,120 |
| 2020 | $4,709 | $31,020 | $10,380 | $20,640 |
| 2019 | $4,654 | $34,200 | $10,380 | $23,820 |
| 2018 | $4,501 | $22,080 | $7,640 | $14,440 |
| 2017 | $4,246 | $20,831 | $6,401 | $14,430 |
| 2016 | $1,343 | $20,831 | $6,401 | $14,430 |
| 2015 | $882 | $18,540 | $8,640 | $9,900 |
| 2014 | $882 | $18,540 | $8,640 | $9,900 |
Source: Public Records
Map
Nearby Homes
- 238-11 148th Dr
- 238-47 148th Dr
- 240-24 149th Ave
- 241-12 148th Ave
- 24112 148th Ave
- 23514 147th Dr
- 241-23 148th Ave
- 23915 147th Rd
- 26 240th St
- 241-49 148th Dr
- 147-11 232nd St
- 147-50 231st St
- 14848 231st St
- 23027 148th Ave
- 24519 147th Dr
- 14632 Huxley St
- 24533 147th Rd
- 245-39 147th Dr
- 146-15 243rd St
- 147-37 230th St
- 14828 Brookville Blvd Unit 2
- 14828 Brookville Blvd
- 14832 Brookville Blvd
- 14832 Brookville Blvd Unit 2nd Fl
- 14832 Brookville Blvd Unit 2 Fl
- 14832 Brookville Blvd
- 235-38 148th Rd Unit 1st Fl
- 235-38 148th Rd
- 23538 148th Rd
- 14836 Brookville Blvd
- 14818 Brookville Blvd
- 23536 148th Rd
- 23537 148th Rd
- 148-40 Brookville Blvd
- 14840 Brookville Blvd
- 23537 148th Rd
- 23532 148th Rd
- 23533 148th Rd
- 14814 Brookville Blvd
- 23611 Bentley Rd