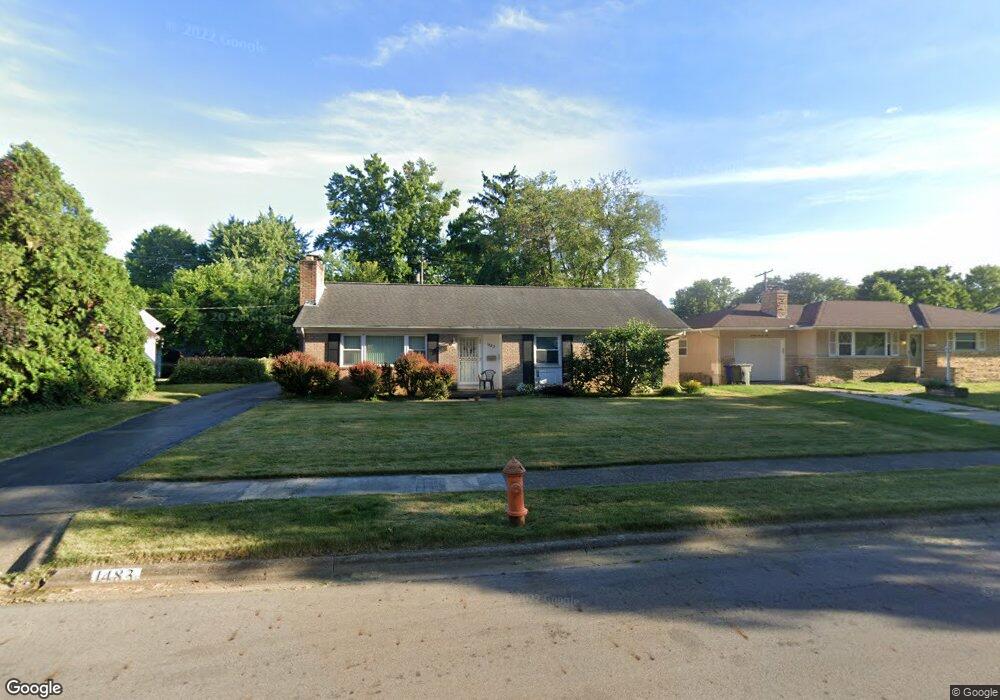
1483 Fahlander Dr S Columbus, OH 43229
Woodward Park NeighborhoodEstimated Value: $272,000 - $307,000
3
Beds
2
Baths
1,367
Sq Ft
$210/Sq Ft
Est. Value
About This Home
This home is located at 1483 Fahlander Dr S, Columbus, OH 43229 and is currently estimated at $287,035, approximately $209 per square foot. 1483 Fahlander Dr S is a home located in Franklin County with nearby schools including Valley Forge Elementary School, Woodward Park Middle School, and Northland High School.
Ownership History
Date
Name
Owned For
Owner Type
Purchase Details
Closed on
Mar 28, 2007
Sold by
Buckland Bob L and Buckland Lee K
Bought by
Robertson Kathleen A
Current Estimated Value
Home Financials for this Owner
Home Financials are based on the most recent Mortgage that was taken out on this home.
Original Mortgage
$126,000
Outstanding Balance
$76,601
Interest Rate
6.25%
Mortgage Type
Purchase Money Mortgage
Estimated Equity
$210,434
Purchase Details
Closed on
Oct 6, 2000
Sold by
Dillon Jeannine
Bought by
Buckland Bob L and Buckland Lee M
Home Financials for this Owner
Home Financials are based on the most recent Mortgage that was taken out on this home.
Original Mortgage
$98,320
Interest Rate
7.96%
Mortgage Type
Purchase Money Mortgage
Purchase Details
Closed on
Dec 6, 1988
Bought by
Dillon Jeannine
Create a Home Valuation Report for This Property
The Home Valuation Report is an in-depth analysis detailing your home's value as well as a comparison with similar homes in the area
Home Values in the Area
Average Home Value in this Area
Purchase History
| Date | Buyer | Sale Price | Title Company |
|---|---|---|---|
| Robertson Kathleen A | $126,000 | Chicago Tit | |
| Buckland Bob L | $122,900 | Preferred Title Agency Inc | |
| Dillon Jeannine | $75,000 | -- |
Source: Public Records
Mortgage History
| Date | Status | Borrower | Loan Amount |
|---|---|---|---|
| Open | Robertson Kathleen A | $126,000 | |
| Previous Owner | Buckland Bob L | $98,320 |
Source: Public Records
Tax History Compared to Growth
Tax History
| Year | Tax Paid | Tax Assessment Tax Assessment Total Assessment is a certain percentage of the fair market value that is determined by local assessors to be the total taxable value of land and additions on the property. | Land | Improvement |
|---|---|---|---|---|
| 2024 | $4,207 | $93,730 | $21,630 | $72,100 |
| 2023 | $4,153 | $93,730 | $21,630 | $72,100 |
| 2022 | $2,892 | $55,760 | $12,740 | $43,020 |
| 2021 | $2,897 | $55,760 | $12,740 | $43,020 |
| 2020 | $2,901 | $55,760 | $12,740 | $43,020 |
| 2019 | $2,710 | $44,670 | $10,190 | $34,480 |
| 2018 | $2,574 | $44,670 | $10,190 | $34,480 |
| 2017 | $2,700 | $44,670 | $10,190 | $34,480 |
| 2016 | $2,692 | $40,640 | $9,450 | $31,190 |
| 2015 | $2,444 | $40,640 | $9,450 | $31,190 |
| 2014 | $2,450 | $40,640 | $9,450 | $31,190 |
| 2013 | $1,272 | $42,770 | $9,940 | $32,830 |
Source: Public Records
Map
Nearby Homes
- 1485 Norma Rd
- 1385 Thurell Rd
- 4923 Karl Rd Unit 4925
- 5022 Sienna Ln
- 4852 Colonel Perry Dr
- 1493 Boxwood Dr
- 1414 Alvina Dr
- 4816 Bourke Rd
- 4815 Bourke Rd
- 5231 Arrowood Ct
- 4800 Bourke Rd
- 1704 Riverbirch Dr
- 4791 Bourke Rd
- 4761 Colonel Perry Dr
- 4904 Almont Dr
- 4983 Almont Dr
- 4840 Almont Dr
- 5124 Northcliff Loop W
- 1125 Upland Dr
- 1116 Tulsa Dr
- 1493 Fahlander Dr S
- 1480 Thurell Rd
- 1465 Fahlander Dr S
- 1488 Thurell Rd
- 1501 Fahlander Dr S
- 1472 Thurell Rd
- 1496 Thurell Rd
- 1480 Fahlander Dr S
- 1492 Fahlander Dr S
- 1464 Thurell Rd
- 1474 Fahlander Dr S
- 1504 Thurell Rd
- 1455 Fahlander Dr S
- 1511 Fahlander Dr S
- 1502 Fahlander Dr S
- 1462 Fahlander Dr S
- 1456 Thurell Rd
- 1512 Thurell Rd
- 1515 Fahlander Dr N
- 1445 Fahlander Dr S