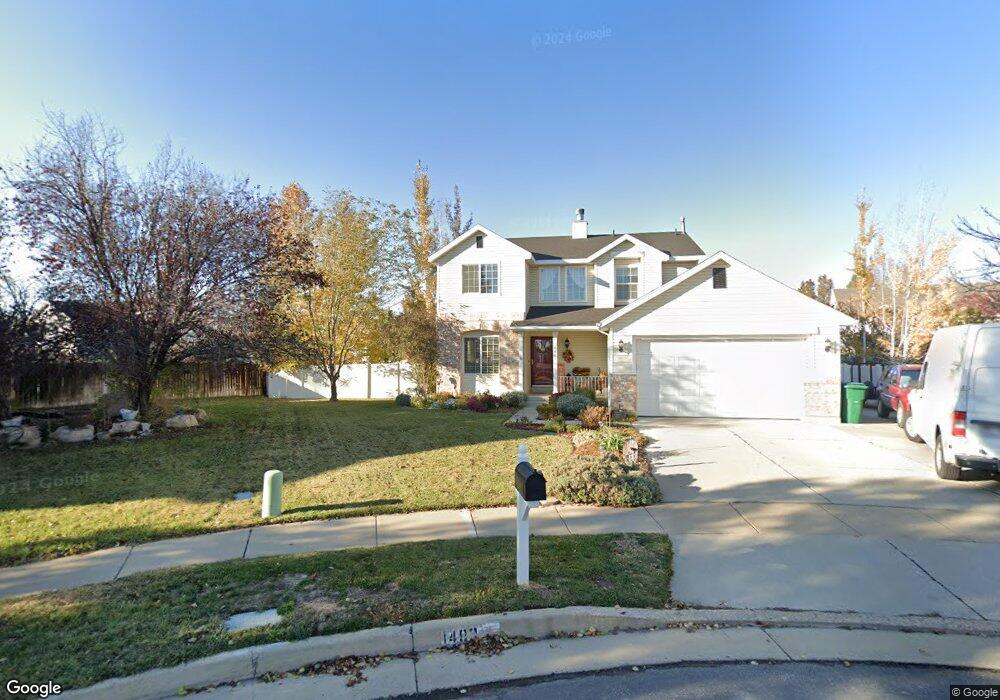
1483 N 285 E Layton, UT 84041
Estimated Value: $486,000 - $504,000
3
Beds
3
Baths
1,887
Sq Ft
$263/Sq Ft
Est. Value
About This Home
This home is located at 1483 N 285 E, Layton, UT 84041 and is currently estimated at $497,085, approximately $263 per square foot. 1483 N 285 E is a home located in Davis County with nearby schools including King Elementary School, Central Davis Junior High School, and Northridge High School.
Ownership History
Date
Name
Owned For
Owner Type
Purchase Details
Closed on
Oct 25, 2010
Sold by
Malnar Lori Ann and Malnar Donald R
Bought by
Malnar Lori Ann
Current Estimated Value
Home Financials for this Owner
Home Financials are based on the most recent Mortgage that was taken out on this home.
Original Mortgage
$182,128
Outstanding Balance
$120,307
Interest Rate
4.37%
Mortgage Type
FHA
Estimated Equity
$376,778
Purchase Details
Closed on
Aug 10, 2009
Sold by
Brown Jerry D and Brown Della K
Bought by
Malnar Lori Ann and Malnar Donald R
Home Financials for this Owner
Home Financials are based on the most recent Mortgage that was taken out on this home.
Original Mortgage
$181,649
Interest Rate
5.17%
Mortgage Type
FHA
Purchase Details
Closed on
Mar 6, 1998
Sold by
Kaufman & Broad Of Utah Inc
Bought by
Brown Jerry D and Brown Della K
Home Financials for this Owner
Home Financials are based on the most recent Mortgage that was taken out on this home.
Original Mortgage
$135,631
Interest Rate
6.99%
Mortgage Type
FHA
Create a Home Valuation Report for This Property
The Home Valuation Report is an in-depth analysis detailing your home's value as well as a comparison with similar homes in the area
Home Values in the Area
Average Home Value in this Area
Purchase History
| Date | Buyer | Sale Price | Title Company |
|---|---|---|---|
| Malnar Lori Ann | -- | Cottonwood Title Ins Agency | |
| Malnar Lori Ann | -- | Hickman Land Title Co | |
| Brown Jerry D | -- | First American Title Co |
Source: Public Records
Mortgage History
| Date | Status | Borrower | Loan Amount |
|---|---|---|---|
| Open | Malnar Lori Ann | $182,128 | |
| Closed | Malnar Lori Ann | $181,649 | |
| Previous Owner | Brown Jerry D | $135,631 |
Source: Public Records
Tax History
| Year | Tax Paid | Tax Assessment Tax Assessment Total Assessment is a certain percentage of the fair market value that is determined by local assessors to be the total taxable value of land and additions on the property. | Land | Improvement |
|---|---|---|---|---|
| 2025 | $2,306 | $242,000 | $121,806 | $120,194 |
| 2024 | $2,205 | $233,200 | $140,991 | $92,209 |
| 2023 | $2,194 | $409,000 | $159,176 | $249,824 |
| 2022 | $2,233 | $226,050 | $86,649 | $139,401 |
| 2021 | $2,087 | $315,000 | $128,414 | $186,586 |
| 2020 | $1,892 | $274,000 | $105,121 | $168,879 |
| 2019 | $1,861 | $264,000 | $97,243 | $166,757 |
| 2018 | $1,686 | $240,000 | $97,243 | $142,757 |
| 2016 | $1,598 | $117,370 | $32,944 | $84,426 |
| 2015 | $1,521 | $106,095 | $32,944 | $73,151 |
| 2014 | $1,447 | $103,196 | $32,944 | $70,252 |
| 2013 | -- | $104,063 | $27,341 | $76,722 |
Source: Public Records
Map
Nearby Homes
Your Personal Tour Guide
Ask me questions while you tour the home.