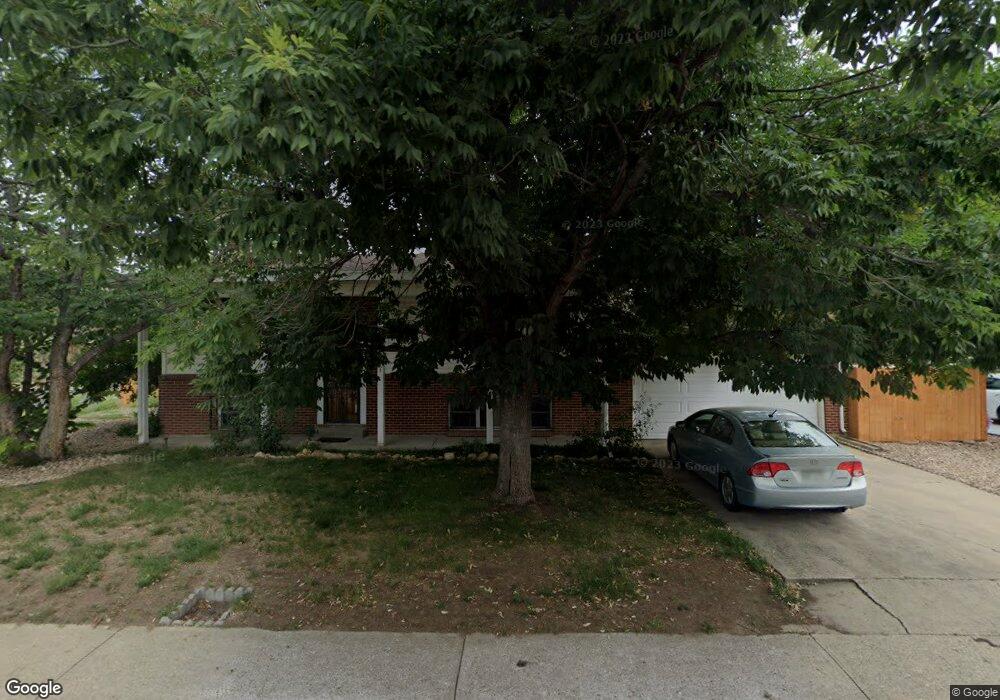
1483 W 100th Place Northglenn, CO 80260
Hillcrest NeighborhoodEstimated Value: $457,718 - $534,000
4
Beds
2
Baths
1,900
Sq Ft
$256/Sq Ft
Est. Value
About This Home
This home is located at 1483 W 100th Place, Northglenn, CO 80260 and is currently estimated at $486,180, approximately $255 per square foot. 1483 W 100th Place is a home located in Adams County with nearby schools including Hillcrest Elementary School, Silver Hills Middle School, and Northglenn High School.
Ownership History
Date
Name
Owned For
Owner Type
Purchase Details
Closed on
Feb 13, 2015
Sold by
Simons Dennis A and Flansburg Jennifer M
Bought by
Tran Andy
Current Estimated Value
Home Financials for this Owner
Home Financials are based on the most recent Mortgage that was taken out on this home.
Original Mortgage
$197,000
Outstanding Balance
$135,433
Interest Rate
1.2%
Mortgage Type
Unknown
Estimated Equity
$350,747
Purchase Details
Closed on
May 15, 2008
Sold by
Wells Fargo Bank Na
Bought by
Simons Dennis A and Flansburg Jennifer M
Home Financials for this Owner
Home Financials are based on the most recent Mortgage that was taken out on this home.
Original Mortgage
$154,812
Interest Rate
6.07%
Mortgage Type
FHA
Purchase Details
Closed on
Mar 6, 2008
Sold by
Jaramillo Duke and Jaramillo Michelle
Bought by
Wells Fargo Bank N A
Create a Home Valuation Report for This Property
The Home Valuation Report is an in-depth analysis detailing your home's value as well as a comparison with similar homes in the area
Home Values in the Area
Average Home Value in this Area
Purchase History
| Date | Buyer | Sale Price | Title Company |
|---|---|---|---|
| Tran Andy | $197,000 | Cti | |
| Simons Dennis A | $157,000 | Chicago Title Co | |
| Wells Fargo Bank N A | -- | None Available |
Source: Public Records
Mortgage History
| Date | Status | Borrower | Loan Amount |
|---|---|---|---|
| Open | Tran Andy | $197,000 | |
| Previous Owner | Simons Dennis A | $154,812 |
Source: Public Records
Tax History Compared to Growth
Tax History
| Year | Tax Paid | Tax Assessment Tax Assessment Total Assessment is a certain percentage of the fair market value that is determined by local assessors to be the total taxable value of land and additions on the property. | Land | Improvement |
|---|---|---|---|---|
| 2024 | $3,419 | $27,630 | $6,250 | $21,380 |
| 2023 | $3,387 | $32,340 | $6,160 | $26,180 |
| 2022 | $3,237 | $25,630 | $6,320 | $19,310 |
| 2021 | $3,343 | $25,630 | $6,320 | $19,310 |
| 2020 | $3,010 | $23,560 | $6,510 | $17,050 |
| 2019 | $3,012 | $23,560 | $6,510 | $17,050 |
| 2018 | $2,144 | $16,340 | $5,900 | $10,440 |
| 2017 | $1,973 | $16,340 | $5,900 | $10,440 |
| 2016 | $1,862 | $15,060 | $3,180 | $11,880 |
| 2015 | $1,859 | $15,060 | $3,180 | $11,880 |
| 2014 | -- | $12,490 | $2,550 | $9,940 |
Source: Public Records
Map
Nearby Homes
- 10023 Pecos St
- 10116 Quivas St
- 10204 Quivas St
- 10143 Quivas St
- 9963 Lane St
- 2100 W 100th Ave Unit 351
- 2100 W 100th Ave
- 2100 W 100th Ave Unit 124
- 2100 W 100th Ave Unit 347
- 2100 W 100th Ave Unit 357
- 2100 W 100th Ave Unit 73
- 2100 W 100th Ave Unit 94
- 2100 W 100th Ave Unit 59
- 2100 W 100th Ave Unit 166
- 2100 W 100th Ave Unit 186
- 2100 W 100th Ave Unit 158
- 2100 W 100th Ave Unit 394
- 9947 Croke Dr
- 1923 W 101st Ave
- 1202 W 103rd Ave
- 1463 W 100th Place
- 1484 W 101st Ave
- 1464 W 101st Ave
- 1482 W 100th Place
- 10043 Pecos St
- 10033 Pecos St
- 1443 W 100th Place
- 1462 W 100th Place
- 10053 Pecos St
- 1444 W 101st Ave
- 1442 W 100th Place
- 10063 Pecos St
- 1423 W 100th Place
- 10013 Pecos St
- 10126 Quivas St
- 1485 W 101st Ave
- 1481 W 100th Ave
- 1424 W 101st Ave
- 10124 Quivas St
- 1465 W 101st Ave