14837 Karlov Ave Midlothian, IL 60445
Estimated payment $1,169/month
Highlights
- Enclosed Patio or Porch
- Laundry Room
- Forced Air Heating System
- Living Room
- 1-Story Property
- Dining Room
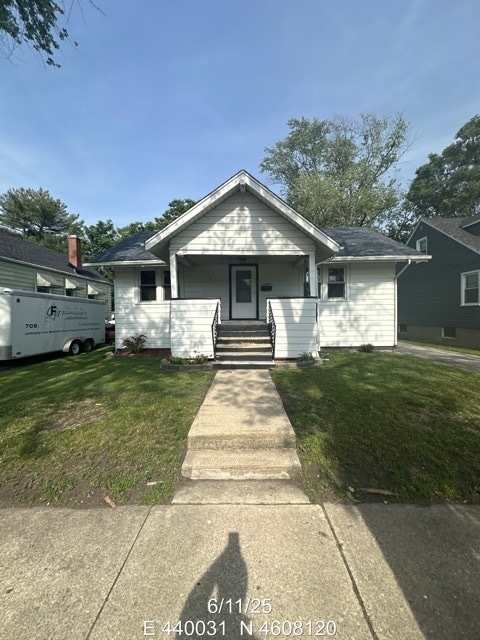
About This Home
Two-bedroom, one bathroom ranch home with full unfinished basement and 1 car detached garage. SELLER DOES NOT PROVIDE SURVEY, TAXES PRORATED AT 100. SOLD AS-IS.
Home Details
Home Type
- Single Family
Est. Annual Taxes
- $5,179
Year Built
- Built in 1926
Parking
- 1 Car Garage
- Parking Included in Price
Home Design
- Steel Siding
Interior Spaces
- 936 Sq Ft Home
- 1-Story Property
- Family Room
- Living Room
- Dining Room
- Basement Fills Entire Space Under The House
- Laundry Room
Bedrooms and Bathrooms
- 2 Bedrooms
- 2 Potential Bedrooms
- 1 Full Bathroom
Utilities
- No Cooling
- Forced Air Heating System
- Heating System Uses Natural Gas
Additional Features
- Enclosed Patio or Porch
- Lot Dimensions are 50 x 140
Map
Home Values in the Area
Average Home Value in this Area
Tax History
| Year | Tax Paid | Tax Assessment Tax Assessment Total Assessment is a certain percentage of the fair market value that is determined by local assessors to be the total taxable value of land and additions on the property. | Land | Improvement |
|---|---|---|---|---|
| 2024 | $5,179 | $17,000 | $2,345 | $14,655 |
| 2023 | $3,335 | $17,000 | $2,345 | $14,655 |
| 2022 | $3,335 | $10,520 | $2,010 | $8,510 |
| 2021 | $3,247 | $10,519 | $2,010 | $8,509 |
| 2020 | $3,190 | $10,519 | $2,010 | $8,509 |
| 2019 | $2,420 | $9,002 | $1,842 | $7,160 |
| 2018 | $2,380 | $9,002 | $1,842 | $7,160 |
| 2017 | $2,318 | $9,002 | $1,842 | $7,160 |
| 2016 | $2,358 | $7,993 | $1,675 | $6,318 |
| 2015 | $2,253 | $7,993 | $1,675 | $6,318 |
| 2014 | $2,618 | $8,999 | $1,675 | $7,324 |
| 2013 | $2,793 | $10,264 | $1,675 | $8,589 |
Property History
| Date | Event | Price | List to Sale | Price per Sq Ft |
|---|---|---|---|---|
| 10/31/2025 10/31/25 | Price Changed | $139,900 | -3.5% | $149 / Sq Ft |
| 09/25/2025 09/25/25 | Price Changed | $144,900 | -3.3% | $155 / Sq Ft |
| 08/25/2025 08/25/25 | Price Changed | $149,900 | -6.3% | $160 / Sq Ft |
| 07/09/2025 07/09/25 | For Sale | $159,900 | 0.0% | $171 / Sq Ft |
| 06/25/2025 06/25/25 | Off Market | $159,900 | -- | -- |
| 06/24/2025 06/24/25 | For Sale | $159,900 | -- | $171 / Sq Ft |
Purchase History
| Date | Type | Sale Price | Title Company |
|---|---|---|---|
| Interfamily Deed Transfer | -- | -- | |
| Warranty Deed | $97,000 | Stewart Title | |
| Warranty Deed | $43,000 | -- |
Mortgage History
| Date | Status | Loan Amount | Loan Type |
|---|---|---|---|
| Open | $96,207 | FHA |
Source: Midwest Real Estate Data (MRED)
MLS Number: 12401817
APN: 28-10-408-008-0000
Disclaimer: Certain information contained herein is derived from information provided by parties other than Homes.com. All information provided is deemed reliable, but is not guaranteed to be accurate and should be independently verified.
![]() Based on information submitted to the MLS GRID. All data is obtained from various sources and may not have been verified by broker or MLS GRID. Supplied Open House Information is subject to change without notice. All information should be independently reviewed and verified for accuracy. Properties may or may not be listed by the office/agent presenting the information. Some IDX listings have been excluded from this website.
Based on information submitted to the MLS GRID. All data is obtained from various sources and may not have been verified by broker or MLS GRID. Supplied Open House Information is subject to change without notice. All information should be independently reviewed and verified for accuracy. Properties may or may not be listed by the office/agent presenting the information. Some IDX listings have been excluded from this website.
The Digital Millennium Copyright Act of 1998, 17 U.S.C. § 512 (the “DMCA”) provides recourse for copyright owners who believe that material appearing on the Internet infringes their rights under U.S. copyright law. If you believe in good faith that any content or material made available in connection with our website or services infringes your copyright, you (or your agent) may send us a notice requesting that the content or material be removed, or access to it blocked.
Notices must be sent in writing by email to DMCAnotice@MLSGrid.com.
The DMCA requires that your notice of alleged copyright infringement include the following information:
(1) description of the copyrighted work that is the subject of claimed infringement;
(2) description of the alleged infringing content and information sufficient to permit us to locate the content;
(3) contact information for you, including your address, telephone number and email address;
(4) a statement by you that you have a good faith belief that the content in the manner complained of is not authorized by the copyright owner, or its agent, or by the operation of any law;
(5) a statement by you, signed under penalty of perjury, that the information in the notification is accurate and that you have the authority to enforce the copyrights that are claimed to be infringed; and
(6) a physical or electronic signature of the copyright owner or a person authorized to act on the copyright owner’s behalf. Failure to include all of the above information may result in the delay of the processing of your complaint.
- 14903 Terrace Ln
- 4031 147th St
- 14970 Pulaski Rd Unit 5
- 14969 Willow Crest Unit 17
- 14618 Keystone Ave
- 14613 Keystone Ave
- 14944 Springfield Ave
- 3846 149th St
- 14914 Avers Ave
- 14601 Tripp Ave
- 14539 Crawford Ave
- 15035 Harding Ave
- 14501 Keystone Ave Unit 8
- 14501 Tripp Ave
- 14827 Kenneth Ave
- 15100 Avers Ave
- 4326 151st St
- 15115 Springfield Ave
- 15031 Hamlin Ave
- 14632 Kostner Ave
- 14325 Karlov Ave
- 15407 Kenton Ave
- 14558 Turner Ave
- 14631 Lamon Ave Unit 2-S
- 4905 143rd Place
- 4800 157th St
- 3028 W 141st St
- 3011 140th Place
- 3824 Sunset Ave
- 3235 W 157th St
- 15515 Long Ave
- 14700 Central Ave
- 2823 Broadway St
- 15447 David Ln
- 15741 Thomas Ln Unit 3BR
- 5125 Coulter Rd
- 12715 S La Crosse Ave Unit 104
- 12549 S Tripp Ave
- 2501 Grove St
- 2501 Grove St
