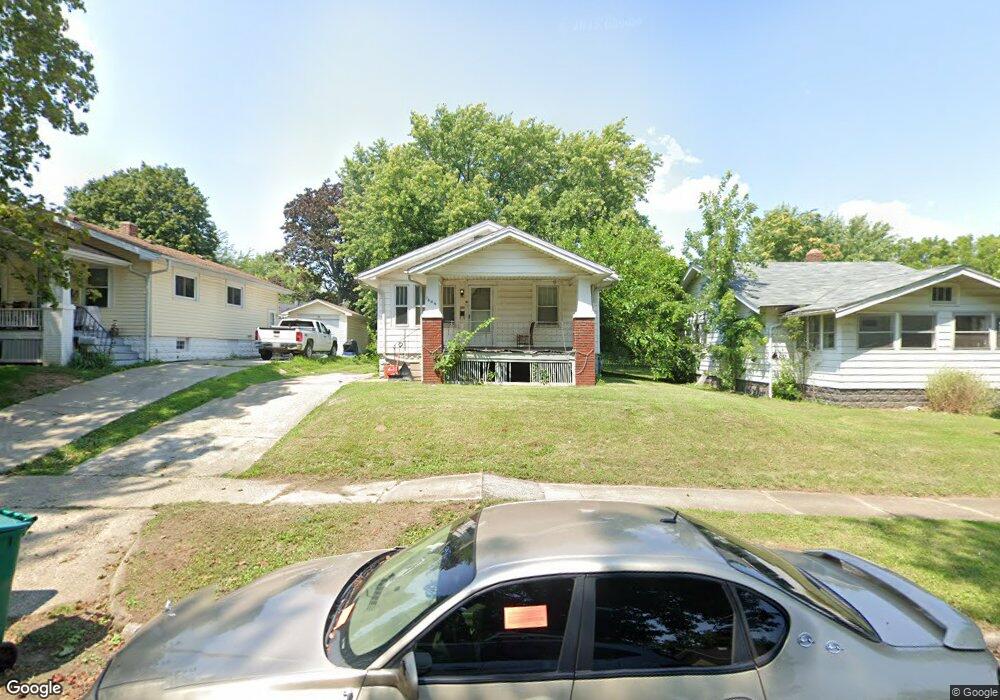
1484 E Moore St Decatur, IL 62521
Lions Park NeighborhoodEstimated Value: $42,000 - $53,000
2
Beds
1
Bath
1,728
Sq Ft
$28/Sq Ft
Est. Value
About This Home
This home is located at 1484 E Moore St, Decatur, IL 62521 and is currently estimated at $48,333, approximately $27 per square foot. 1484 E Moore St is a home located in Macon County with nearby schools including Muffley Elementary School, Stephen Decatur Middle School, and St. Patrick School.
Ownership History
Date
Name
Owned For
Owner Type
Purchase Details
Closed on
Sep 28, 2022
Sold by
Rock It Properties I Llc
Bought by
Bushnell Investments Llc
Current Estimated Value
Home Financials for this Owner
Home Financials are based on the most recent Mortgage that was taken out on this home.
Original Mortgage
$815,000
Interest Rate
5.55%
Mortgage Type
Construction
Purchase Details
Closed on
Jul 27, 2022
Sold by
2M Properties Inc
Bought by
Rock It Properties I Llc
Home Financials for this Owner
Home Financials are based on the most recent Mortgage that was taken out on this home.
Original Mortgage
$805,000
Interest Rate
5.81%
Mortgage Type
Construction
Purchase Details
Closed on
Jul 7, 2006
Sold by
Mccabe John W
Bought by
2M Properties Inc
Purchase Details
Closed on
May 21, 2005
Sold by
Mccabe Barbara N and Mccabe John W
Bought by
Mccabe John W
Purchase Details
Closed on
Oct 1, 1993
Create a Home Valuation Report for This Property
The Home Valuation Report is an in-depth analysis detailing your home's value as well as a comparison with similar homes in the area
Home Values in the Area
Average Home Value in this Area
Purchase History
| Date | Buyer | Sale Price | Title Company |
|---|---|---|---|
| Bushnell Investments Llc | $975,000 | -- | |
| Rock It Properties I Llc | $805,000 | Elias Meginnes & Seghetti Pc | |
| 2M Properties Inc | $24,500 | None Available | |
| Mccabe John W | -- | None Available | |
| -- | $27,000 | -- |
Source: Public Records
Mortgage History
| Date | Status | Borrower | Loan Amount |
|---|---|---|---|
| Closed | Bushnell Investments Llc | $815,000 | |
| Previous Owner | Rock It Properties I Llc | $805,000 |
Source: Public Records
Tax History
| Year | Tax Paid | Tax Assessment Tax Assessment Total Assessment is a certain percentage of the fair market value that is determined by local assessors to be the total taxable value of land and additions on the property. | Land | Improvement |
|---|---|---|---|---|
| 2024 | $899 | $9,291 | $1,261 | $8,030 |
| 2023 | $892 | $8,962 | $1,216 | $7,746 |
| 2022 | $859 | $8,401 | $1,125 | $7,276 |
| 2021 | $807 | $7,846 | $1,051 | $6,795 |
| 2020 | $796 | $7,481 | $1,002 | $6,479 |
| 2019 | $796 | $7,481 | $1,002 | $6,479 |
| 2018 | $884 | $8,413 | $1,712 | $6,701 |
| 2017 | $905 | $8,638 | $1,758 | $6,880 |
| 2016 | $922 | $8,726 | $1,776 | $6,950 |
| 2015 | $876 | $8,572 | $1,745 | $6,827 |
| 2014 | $814 | $8,487 | $1,728 | $6,759 |
| 2013 | $841 | $8,806 | $1,793 | $7,013 |
Source: Public Records
Map
Nearby Homes
- 632 S 17th St
- 855 S Stone St
- 1422 Sedgwick St
- 1263 Sedgwick St
- 1739 E Johns Ave
- 1430 E Vanderhoof St
- 1722 E Johns Ave
- 1608 E Clay St
- 1987 E Cantrell St
- 966 E Cantrell St
- 230 S 16th St
- 2039 E Whitmer St
- 936 E Moore St
- 2104 E Whitmer St
- 1202 Florida Ave
- 1135 S 21st St
- 1221 E Main St
- 729 S 22nd St
- 1283 S Illinois St
- 1225 S Silas St
- 1504 E Moore St
- 1474 E Moore St
- 1514 E Moore St
- 1468 E Moore St
- 745 S 16th St
- 1527 E Whitmer St
- 1529 E Whitmer St
- 1524 E Moore St
- 1454 E Moore St
- 1523 E Whitmer St
- 1537 E Whitmer St
- 725 S 16th St
- 1515 E Moore St
- 1525 E Whitmer St
- 1455 E Whitmer St
- 1444 E Moore St
- 1465 E Moore St
- 1505 E Moore St
- 1459 E Moore St
- 1525 E Moore St
Your Personal Tour Guide
Ask me questions while you tour the home.