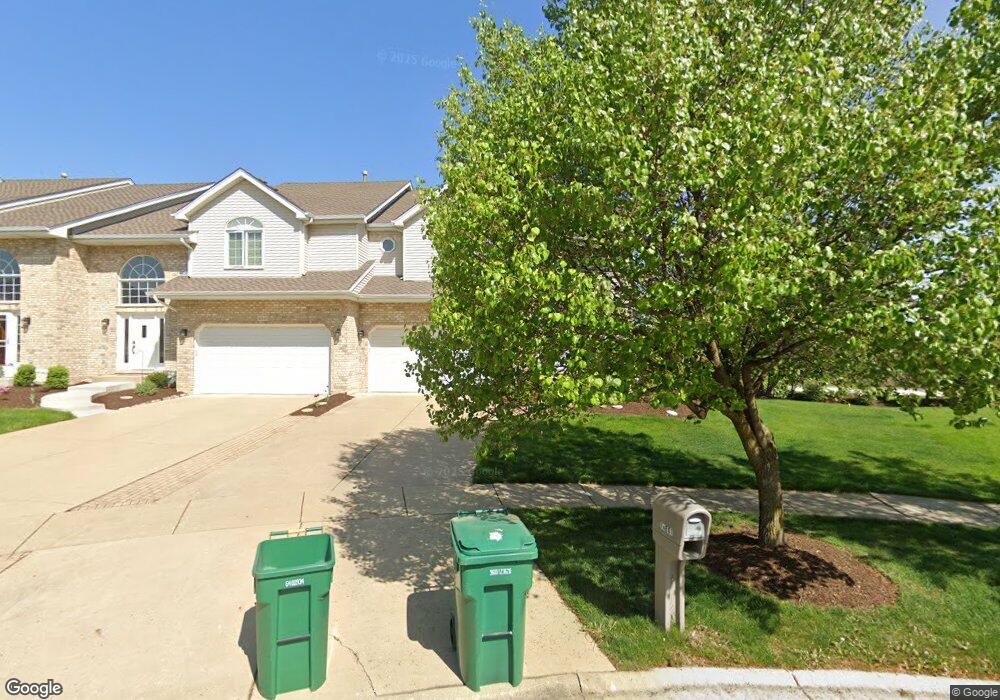
14841 Steven Ct Lemont, IL 60439
Southeast Lemont NeighborhoodEstimated Value: $481,000 - $545,000
3
Beds
3
Baths
2,496
Sq Ft
$204/Sq Ft
Est. Value
About This Home
This home is located at 14841 Steven Ct, Lemont, IL 60439 and is currently estimated at $509,323, approximately $204 per square foot. 14841 Steven Ct is a home located in Cook County with nearby schools including Oakwood School, River Valley School, and Old Quarry Middle School.
Ownership History
Date
Name
Owned For
Owner Type
Purchase Details
Closed on
Dec 9, 2009
Sold by
Maurukas Rimas
Bought by
Urbis Michelle L
Current Estimated Value
Home Financials for this Owner
Home Financials are based on the most recent Mortgage that was taken out on this home.
Original Mortgage
$263,000
Outstanding Balance
$169,183
Interest Rate
4.87%
Mortgage Type
New Conventional
Estimated Equity
$340,140
Purchase Details
Closed on
Nov 24, 2008
Sold by
Urbis Michelle L
Bought by
Urbis Michelle L and Maurukas Rimas
Purchase Details
Closed on
Sep 30, 1999
Sold by
State Bank Of Countryside
Bought by
Urbis Michelle L
Home Financials for this Owner
Home Financials are based on the most recent Mortgage that was taken out on this home.
Original Mortgage
$207,000
Interest Rate
7%
Create a Home Valuation Report for This Property
The Home Valuation Report is an in-depth analysis detailing your home's value as well as a comparison with similar homes in the area
Home Values in the Area
Average Home Value in this Area
Purchase History
| Date | Buyer | Sale Price | Title Company |
|---|---|---|---|
| Urbis Michelle L | -- | Citywide Title Corporation | |
| Urbis Michelle L | $30,000 | None Available | |
| Urbis Michelle L | $200,000 | -- |
Source: Public Records
Mortgage History
| Date | Status | Borrower | Loan Amount |
|---|---|---|---|
| Open | Urbis Michelle L | $263,000 | |
| Previous Owner | Urbis Michelle L | $207,000 |
Source: Public Records
Tax History
| Year | Tax Paid | Tax Assessment Tax Assessment Total Assessment is a certain percentage of the fair market value that is determined by local assessors to be the total taxable value of land and additions on the property. | Land | Improvement |
|---|---|---|---|---|
| 2025 | $7,832 | $41,000 | $16,574 | $24,426 |
| 2024 | $7,832 | $41,000 | $16,574 | $24,426 |
| 2023 | $6,336 | $41,000 | $16,574 | $24,426 |
| 2022 | $6,336 | $29,520 | $14,503 | $15,017 |
| 2021 | $6,163 | $29,518 | $14,502 | $15,016 |
| 2020 | $6,282 | $29,518 | $14,502 | $15,016 |
| 2019 | $6,571 | $31,837 | $14,502 | $17,335 |
| 2018 | $6,461 | $31,837 | $14,502 | $17,335 |
| 2017 | $6,378 | $31,837 | $14,502 | $17,335 |
| 2016 | $5,861 | $27,321 | $11,912 | $15,409 |
| 2015 | $5,918 | $27,321 | $11,912 | $15,409 |
| 2014 | $5,988 | $27,321 | $11,912 | $15,409 |
| 2013 | $5,887 | $28,528 | $11,912 | $16,616 |
Source: Public Records
Map
Nearby Homes
- 14825 Steven Ct
- 1396 Notre Dame Dr
- 12915 Archer Ave
- 13100 Fox Ln
- 1268 Durham Ln
- 1204 Prairie Ln
- 1200 Prairie Ln Unit 1-A
- 1224 Prairie Ln
- 1228 Prairie Ln Unit 4B
- 1228 Prairie Ln
- 1232 Prairie Ln Unit 5-A
- 1236 Prairie Ln Unit 5-B
- 1139 Gillian St
- 1343 Camelot Ln
- 13220 Fox Ln
- 14517 Albany Ave
- 12799 Saint Andrews Ct Unit 3-202
- 1297 Mccarthy Rd
- 14277 Lacey Dr
- 15500 E 127th St
- 14843 Steven Ct
- 14827 Steven Ct
- 14845 Steven Ct
- 14847 Steven Ct
- 14823 Steven Ct
- 14823 Steven Ct Unit 1482
- 14809 Steven Ct
- 16461 Kayla Dr
- 16491 Kayla Dr
- 14863 Steven Ct
- 12753 Cheiftain Ct
- 14865 Steven Ct
- 14801 Steven Ct
- 14867 Steven Ct
- 12756 Cheiftain Ct
- 12761 Cheiftain Ct
- 12761 Cheiftain Ct Unit C
- 14788 E 127th St
- 14869 Steven Ct
- 12762 Cheiftain Ct Unit C
Your Personal Tour Guide
Ask me questions while you tour the home.