14844 Langley Ave Dolton, IL 60419
Estimated Value: $116,312 - $170,000
About This Home
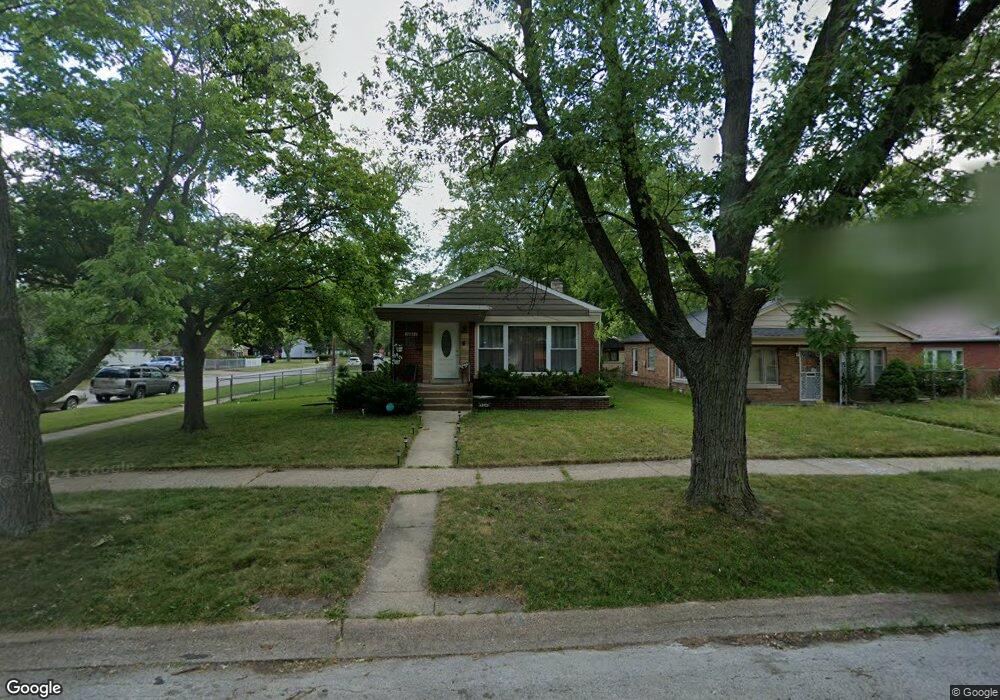
This home is located at 14844 Langley Ave, Dolton, IL 60419 and is currently estimated at $135,828, approximately $130 per square foot. 14844 Langley Ave is a home located in Cook County with nearby schools including Franklin Elementary School, Lincoln Junior High School, and Thornridge High School.
Ownership History
We collect this data history from publicly available records. To have your information removed, we recommend requesting removal directly through your county’s website.
Purchase Details
Home Financials for this Owner
Home Financials are based on the most recent Mortgage that was taken out on this home.Purchase Details
Home Financials for this Owner
Home Financials are based on the most recent Mortgage that was taken out on this home.Purchase Details
Purchase Details
Home Values in the Area
Average Home Value in this Area
Purchase History
We collect this data history from publicly available records. To have your information removed, we recommend requesting removal directly through your county’s website.
| Date | Buyer | Sale Price | Title Company |
|---|---|---|---|
| $135,000 | Chicago Title | ||
| $100,000 | Attorney | ||
| -- | First American Title Company | ||
| -- | Attorney |
Mortgage History
We collect this data history from publicly available records. To have your information removed, we recommend requesting removal directly through your county’s website.
| Date | Status | Borrower | Loan Amount |
|---|---|---|---|
| Open | $132,554 | ||
| Previous Owner | $98,187 |
Tax History
We collect this data history from publicly available records. To have your information removed, we recommend requesting removal directly through your county’s website.
| Year | Tax Paid | Tax Assessment Tax Assessment Total Assessment is a certain percentage of the fair market value that is determined by local assessors to be the total taxable value of land and additions on the property. | Land | Improvement |
|---|---|---|---|---|
| 2025 | $3,946 | $8,651 | $1,581 | $7,070 |
| 2024 | $3,946 | $8,651 | $1,581 | $7,070 |
| 2023 | $2,954 | $8,651 | $1,581 | $7,070 |
| 2022 | $2,954 | $6,221 | $1,395 | $4,826 |
| 2021 | $2,980 | $6,219 | $1,395 | $4,824 |
| 2020 | $2,960 | $6,219 | $1,395 | $4,824 |
| 2019 | $5,292 | $6,037 | $1,302 | $4,735 |
| 2018 | $5,133 | $6,037 | $1,302 | $4,735 |
| 2017 | $2,670 | $6,037 | $1,302 | $4,735 |
| 2016 | $2,628 | $5,582 | $1,209 | $4,373 |
| 2015 | $2,476 | $5,582 | $1,209 | $4,373 |
| 2014 | $2,488 | $5,582 | $1,209 | $4,373 |
| 2013 | $2,596 | $6,108 | $1,209 | $4,899 |
Map
- 14832 Langley Ave
- 14838 Champlain St
- 14845 Evans Ave
- 14930 Irving Ave
- 15029 Irving Ave
- 14900 Oak St
- 14940 Oak St
- 14800 Irving Ave
- 654 E Sibley Blvd
- 14819 Evers St
- 15019 Evers St
- 14823 Grant St
- 14640 Memorial Dr
- 14909 Martin Luther King jr Dr
- 14806 Grant St
- 830 E 152nd St
- 15223 Naughton Dr
- 15210 Evers St
- 15214 Evers St
- 14526 Cottage Grove Ave
- 14916 Langley Ave
- 14918 Langley Ave
- 14912 Langley Ave
- 14922 Langley Ave
- 14908 Langley Ave
- 14926 Langley Ave
- 14904 Langley Ave
- 14917 Champlain Ave
- 14915 Champlain Ave
- 14911 Champlain Ave
- 14923 Champlain Ave
- 14928 Langley Ave
- 14907 Champlain Ave
- 14900 Langley Ave
- 14927 Champlain Ave
- 14915 Langley Ave
- 14919 Langley Ave
- 14905 Champlain Ave
- 14921 Langley Ave
- 14932 Langley Ave
Ask me questions while you tour the home.