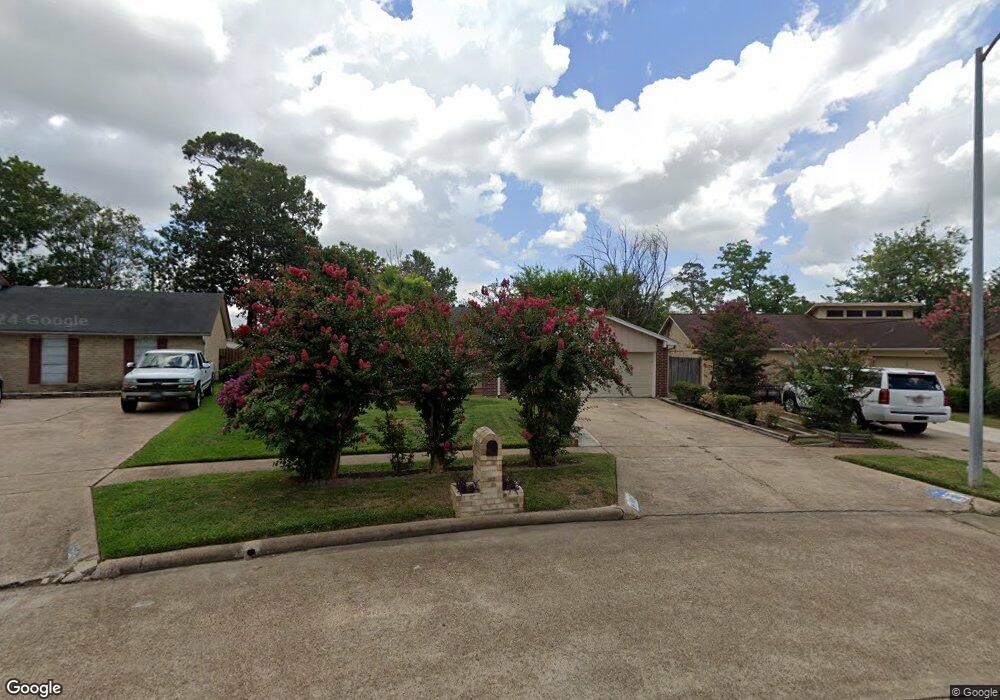
14847 Croxton Dr Houston, TX 77015
Estimated Value: $226,000 - $244,000
4
Beds
2
Baths
1,730
Sq Ft
$136/Sq Ft
Est. Value
About This Home
This home is located at 14847 Croxton Dr, Houston, TX 77015 and is currently estimated at $235,277, approximately $135 per square foot. 14847 Croxton Dr is a home located in Harris County with nearby schools including James B. Havard Elementary School, Cobb 6th Grade Campus, and North Shore Middle School.
Ownership History
Date
Name
Owned For
Owner Type
Purchase Details
Closed on
May 10, 2023
Sold by
Salinas Hector
Bought by
Salinas Mercado Hector G and Salinas Nayeli Nayeli
Current Estimated Value
Home Financials for this Owner
Home Financials are based on the most recent Mortgage that was taken out on this home.
Original Mortgage
$228,000
Outstanding Balance
$221,579
Interest Rate
6.32%
Mortgage Type
New Conventional
Estimated Equity
$13,698
Purchase Details
Closed on
Nov 8, 2022
Sold by
Rivera-Martinez Martha
Bought by
Salinas Hector
Purchase Details
Closed on
May 22, 2014
Sold by
Day Rebeca Rivera and Mayorg Aracely Rivera
Bought by
Rivera Joel Briones
Purchase Details
Closed on
Aug 31, 1998
Sold by
Titan Land Development Inc
Bought by
Mhi Partnership Ltd
Create a Home Valuation Report for This Property
The Home Valuation Report is an in-depth analysis detailing your home's value as well as a comparison with similar homes in the area
Home Values in the Area
Average Home Value in this Area
Purchase History
| Date | Buyer | Sale Price | Title Company |
|---|---|---|---|
| Salinas Mercado Hector G | -- | None Listed On Document | |
| Salinas Hector | -- | Capital Title | |
| Rivera Joel Briones | -- | None Available | |
| Mhi Partnership Ltd | -- | Mhi Title |
Source: Public Records
Mortgage History
| Date | Status | Borrower | Loan Amount |
|---|---|---|---|
| Open | Salinas Mercado Hector G | $228,000 |
Source: Public Records
Tax History Compared to Growth
Tax History
| Year | Tax Paid | Tax Assessment Tax Assessment Total Assessment is a certain percentage of the fair market value that is determined by local assessors to be the total taxable value of land and additions on the property. | Land | Improvement |
|---|---|---|---|---|
| 2025 | $5,085 | $213,448 | $44,635 | $168,813 |
| 2024 | $5,085 | $228,470 | $44,635 | $183,835 |
| 2023 | $5,085 | $237,181 | $44,635 | $192,546 |
| 2022 | $4,140 | $195,101 | $44,635 | $150,466 |
| 2021 | $4,142 | $171,677 | $44,635 | $127,042 |
| 2020 | $4,044 | $148,316 | $44,635 | $103,681 |
| 2019 | $3,896 | $138,070 | $44,635 | $93,435 |
| 2018 | $530 | $129,688 | $32,803 | $96,885 |
| 2017 | $3,276 | $108,120 | $20,502 | $87,618 |
| 2016 | $2,978 | $108,120 | $20,502 | $87,618 |
| 2015 | $1,070 | $88,437 | $11,276 | $77,161 |
| 2014 | $1,070 | $82,710 | $11,276 | $71,434 |
Source: Public Records
Map
Nearby Homes
- 1423 Seafield Dr
- 1303 Sterling Green Ct
- 14808 Welbeck Dr
- 1346 Castle Glen Dr
- 14806 Beaconsfield Dr
- 1342 Castle Glen Dr
- 14835 Scotter Dr
- 1610 Evesham Dr
- 14854 Shottery Dr
- 14918 Silver Green Dr S
- 14807 Shottery Dr
- 14847 Shottery Dr
- 14951 Scotter Dr
- 1323 Padstow Ln
- 14615 Woodmaple Ct
- 1343 Littleport Ln
- 111 Ambershadow Dr
- 1915 Aldates Dr
- 909 Pennygent Ln
- 1102 Heathfield Dr
- 14851 Croxton Dr
- 14843 Croxton Dr
- 14915 Easingwold Dr
- 14855 Croxton Dr
- 14911 Easingwold Dr
- 14839 Croxton Dr
- 14919 Easingwold Dr
- 14859 Croxton Dr
- 14850 Croxton Dr
- 14907 Easingwold Dr
- 14835 Croxton Dr
- 14838 Croxton Dr
- 14854 Croxton Dr
- 14863 Croxton Dr
- 14903 Easingwold Dr
- 14914 Easingwold Dr
- 14834 Croxton Dr
- 14858 Croxton Dr
- 14831 Croxton Dr
- 14910 Easingwold Dr