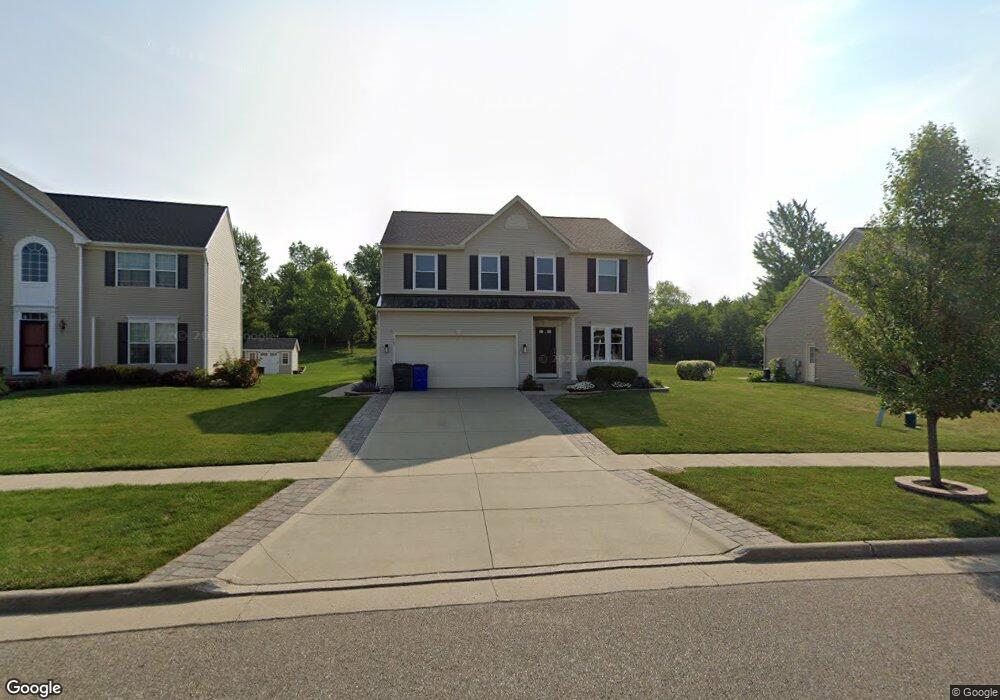
1485 Duncan Way Streetsboro, OH 44241
Estimated Value: $384,000 - $449,000
3
Beds
3
Baths
2,528
Sq Ft
$165/Sq Ft
Est. Value
About This Home
This home is located at 1485 Duncan Way, Streetsboro, OH 44241 and is currently estimated at $416,127, approximately $164 per square foot. 1485 Duncan Way is a home located in Portage County with nearby schools including Streetsboro High School and Crossroads Christian Academy.
Ownership History
Date
Name
Owned For
Owner Type
Purchase Details
Closed on
Jun 12, 2017
Sold by
Equity Trust Company Custodian and Ira Jeffrey S English
Bought by
Page Jaime A and Page Melissa A
Current Estimated Value
Home Financials for this Owner
Home Financials are based on the most recent Mortgage that was taken out on this home.
Original Mortgage
$173,492
Outstanding Balance
$144,309
Interest Rate
4.02%
Mortgage Type
New Conventional
Estimated Equity
$271,818
Purchase Details
Closed on
Mar 20, 2017
Sold by
Brown Noralena
Bought by
Equity Trust Co and Jeffrey S English Ira
Purchase Details
Closed on
Sep 23, 2010
Sold by
Nvr Inc
Bought by
Brown Noralena
Home Financials for this Owner
Home Financials are based on the most recent Mortgage that was taken out on this home.
Original Mortgage
$224,617
Interest Rate
4.26%
Mortgage Type
VA
Purchase Details
Closed on
Jul 22, 2010
Sold by
Streetsboro Land Group Ltd
Bought by
Nvr Inc and Ryan Homes
Create a Home Valuation Report for This Property
The Home Valuation Report is an in-depth analysis detailing your home's value as well as a comparison with similar homes in the area
Home Values in the Area
Average Home Value in this Area
Purchase History
| Date | Buyer | Sale Price | Title Company |
|---|---|---|---|
| Page Jaime A | $217,500 | Ohio Real Title | |
| Equity Trust Co | $172,300 | None Available | |
| Brown Noralena | $219,900 | Nvr Title Agency Llc | |
| Nvr Inc | $48,000 | None Available |
Source: Public Records
Mortgage History
| Date | Status | Borrower | Loan Amount |
|---|---|---|---|
| Open | Page Jaime A | $173,492 | |
| Previous Owner | Brown Noralena | $224,617 |
Source: Public Records
Tax History Compared to Growth
Tax History
| Year | Tax Paid | Tax Assessment Tax Assessment Total Assessment is a certain percentage of the fair market value that is determined by local assessors to be the total taxable value of land and additions on the property. | Land | Improvement |
|---|---|---|---|---|
| 2024 | $5,171 | $125,130 | $19,250 | $105,880 |
| 2023 | $4,719 | $93,490 | $18,130 | $75,360 |
| 2022 | $4,726 | $93,490 | $18,130 | $75,360 |
| 2021 | $4,840 | $93,490 | $18,130 | $75,360 |
| 2020 | $4,587 | $81,270 | $15,750 | $65,520 |
| 2019 | $4,629 | $81,270 | $15,750 | $65,520 |
| 2018 | $3,505 | $70,070 | $15,750 | $54,320 |
| 2017 | $3,505 | $70,070 | $15,750 | $54,320 |
| 2016 | $3,716 | $70,070 | $15,750 | $54,320 |
| 2015 | $3,484 | $70,070 | $15,750 | $54,320 |
| 2014 | $3,823 | $66,500 | $15,750 | $50,750 |
| 2013 | $3,689 | $66,500 | $15,750 | $50,750 |
Source: Public Records
Map
Nearby Homes
- 1448 Jude Ave
- 8807 Kelly Ln
- 1489 Crescent Dr
- 1654 Leslie Dr
- 1648 Maple View Ct
- 1675 Duncan Way
- 1678 Duncan Way
- V/L State Route 14
- 1446 Trader Dr Unit H5
- 1440 Trader Dr
- 9012 Patriot Dr
- 9018 Patriot Dr
- 8158 State Route 43
- 9244 Lakeside Dr
- 9315 June Dr
- 1490 Evergreen Dr
- 9431 Briar Dr
- 939 State Route 303
- 1011 Ashwood Ln
- 9247 Chestnut Ct
- 1481 Duncan Way
- 1489 Duncan Way
- 1477 Duncan Way
- 1493 Duncan Way
- 1495 Duncan Way
- 1472 Duncan Way
- 1682 Dublin Way
- 1694 Dublin Way
- 1690 Dublin Way
- 1468 Duncan Way
- 8704 Mavis Trail
- 1469 Duncan Way
- 1464 Duncan Way
- 1467 Mclean Ave
- 0 Duncan Way
- 8712 Mavis Trail
- 1460 Duncan Way
- 1463 Mclean Ave
- 1526 Clover Ct
- 1498 Duncan Way