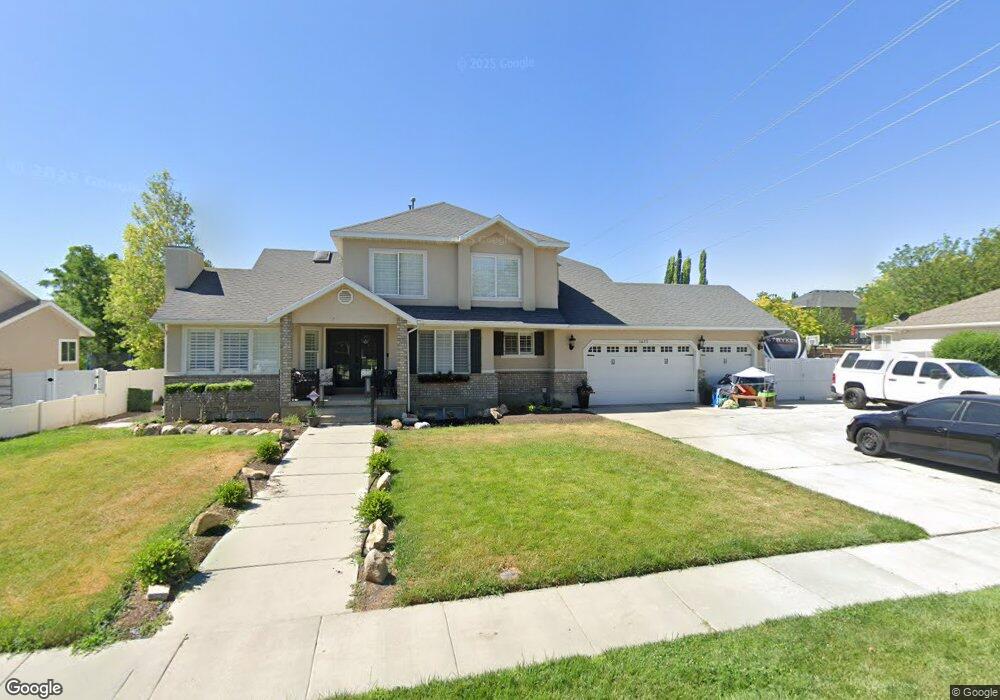
1485 Misty Fen Way West Jordan, UT 84088
Estimated Value: $748,000 - $1,020,000
6
Beds
4
Baths
4,248
Sq Ft
$201/Sq Ft
Est. Value
About This Home
This home is located at 1485 Misty Fen Way, West Jordan, UT 84088 and is currently estimated at $853,129, approximately $200 per square foot. 1485 Misty Fen Way is a home located in Salt Lake County with nearby schools including Riverside Elementary School, West Jordan Middle School, and West Jordan High School.
Ownership History
Date
Name
Owned For
Owner Type
Purchase Details
Closed on
Jun 2, 2009
Sold by
Krynen Richard D and Krynen Jennifer
Bought by
Krynen Jennifer B
Current Estimated Value
Purchase Details
Closed on
May 15, 1997
Sold by
Biesinger John
Bought by
Krynen Richard D and Krynen Jennifer
Home Financials for this Owner
Home Financials are based on the most recent Mortgage that was taken out on this home.
Original Mortgage
$251,100
Interest Rate
8.14%
Purchase Details
Closed on
Oct 30, 1995
Sold by
Hafeman William C and Christensen Don M
Bought by
Biesinger John
Create a Home Valuation Report for This Property
The Home Valuation Report is an in-depth analysis detailing your home's value as well as a comparison with similar homes in the area
Home Values in the Area
Average Home Value in this Area
Purchase History
| Date | Buyer | Sale Price | Title Company |
|---|---|---|---|
| Krynen Jennifer B | -- | Richland Title Ins Agency In | |
| Krynen Richard D | -- | -- | |
| Biesinger John | -- | First American Title |
Source: Public Records
Mortgage History
| Date | Status | Borrower | Loan Amount |
|---|---|---|---|
| Previous Owner | Krynen Richard D | $251,100 |
Source: Public Records
Tax History Compared to Growth
Tax History
| Year | Tax Paid | Tax Assessment Tax Assessment Total Assessment is a certain percentage of the fair market value that is determined by local assessors to be the total taxable value of land and additions on the property. | Land | Improvement |
|---|---|---|---|---|
| 2025 | $2,126 | $788,500 | $145,000 | $643,500 |
| 2024 | $2,126 | $776,700 | $143,500 | $633,200 |
| 2023 | $2,001 | $711,600 | $129,300 | $582,300 |
| 2022 | $2,855 | $715,800 | $126,700 | $589,100 |
| 2021 | $2,002 | $525,600 | $95,000 | $430,600 |
| 2020 | $1,855 | $480,400 | $95,000 | $385,400 |
| 2019 | $1,855 | $471,100 | $95,000 | $376,100 |
| 2018 | $1,673 | $437,400 | $93,800 | $343,600 |
| 2017 | $1,582 | $419,100 | $93,800 | $325,300 |
| 2016 | $71 | $391,800 | $93,800 | $298,000 |
| 2015 | $1,361 | $367,400 | $95,600 | $271,800 |
| 2014 | $1,238 | $345,300 | $91,100 | $254,200 |
Source: Public Records
Map
Nearby Homes
- 1673 Peaceful Cir
- 8686 S Temple Dr
- 9511 S Tirado Cove Unit 204
- Brook Haven Plan at Jordan Woods
- Maple Plan at Jordan Woods
- The Maple Basement Plan at Jordan Woods
- The Evergreen Basement Plan at Jordan Woods
- 9503 S Tirado Cove Unit 203
- 1719 W Brocious Way Unit 301
- 1753 Rylie Ann Cir
- 9635 S 1600 W
- 9141 S Little Creek Dr
- 1741 W Nikos Ln
- 1718 W Thira Ln
- 9496 S 1930 W
- 1968 W 9270 S Unit C
- 1767 W Ikaros Ln
- 1788 W Ikaros Ln
- 9414 S 1980 W
- 9297 S Avignon Place
- 1471 W Misty Fen Way
- 1471 Misty Fen Way
- 1505 Misty Fen Way
- 1505 W Misty Fen Way
- 1459 W Misty Fen Way
- 9422 Morywood Cir
- 9422 S Morywood Cir
- 1439 Misty Fen Way
- 9418 S Morywood Cir
- 9418 Morywood Cir
- 1486 Misty Fen Way
- 9429 Dunbar Cove
- 1521 Misty Fen Way
- 1521 W Misty Fen Way Unit 50
- 1472 Misty Fen Way
- 1506 Misty Fen Way
- 9423 Dunbar Cove
- 9362 Mac Duff Ln
- 9362 S Mac Duff Ln
- 1456 W 9380 S Unit 37